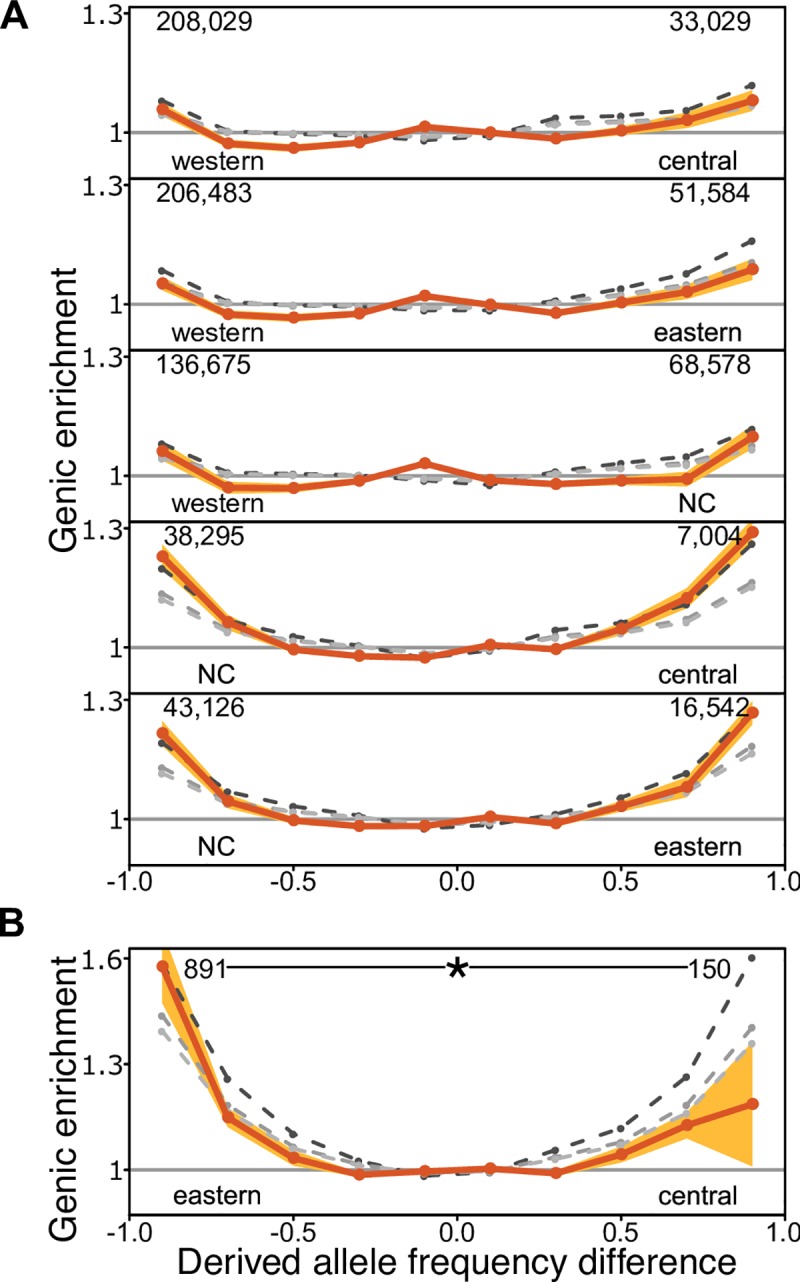
Fig 2. Genic enrichment in bins of signed difference in derived allele frequency (δ).

A, X-axis: δ is computed as the difference in derived allele frequency, for each pair of chimpanzee subspecies. Tail bins (the last bin in either end of δ) contain those SNPs with the largest allele frequency differences. Numbers are of the genic SNPs in each tail bin. Y-axis: genic enrichment in each δ bin (Methods). B, Genic enrichment eastern and central chimpanzee δ, plotted separately due to a different Y-axis limit. NC = Nigeria-Cameroon. The asterisk shows significance of the asymmetry in the genic enrichment (* = 0.01). Shading represents the 95% CI (i.e. alpha = 0.05 for a two-tailed test) estimated by 200kb weighted block jackknife. Grey dashed lines represent simulations under increasing levels of background selection that best match different aspects of the data: lightest to darkest shades: B = 0.93 (excluding δ tail bins), 0.92 (all δ bins), and 0.88 (unmodified genic B values form McVicker et. al. 2009 [34]).
