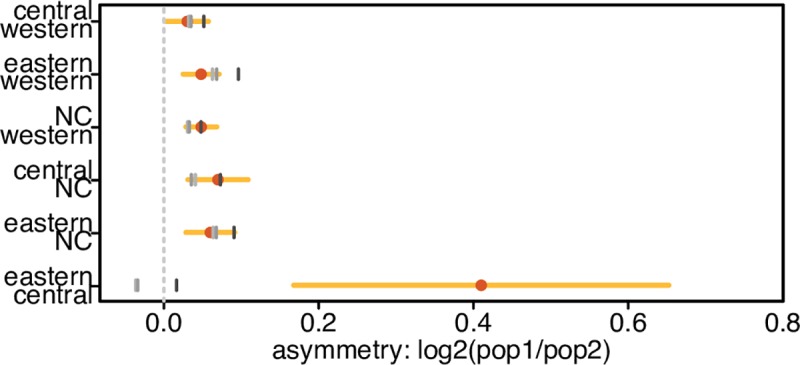
Fig 3. Direct quantification of δ tail bin genic enrichment asymmetry.

The asymmetry of the genic enrichments in the δ tails is measured by taking their log2 ratio, thus 0 indicates a symmetric enrichment (equal enrichment in both δ tails). NC = Nigeria-Cameroon. Dot = observed asymmetry. Horizontal lines represent confidence intervals estimated by 200kb weighted block jackknife (light = 95%, i.e. alpha = 0.05 for a two-tailed test). Grey vertical marks represent the δ tail asymmetry in simulations, under increasing levels of background selection that best match different aspects of the data: lightest to darkest shades: B = 0.93 (excluding δ tail bins), 0.92 (all δ bins), and 0.88 (unmodified genic B values form McVicker et. al. 2009 [34]).
