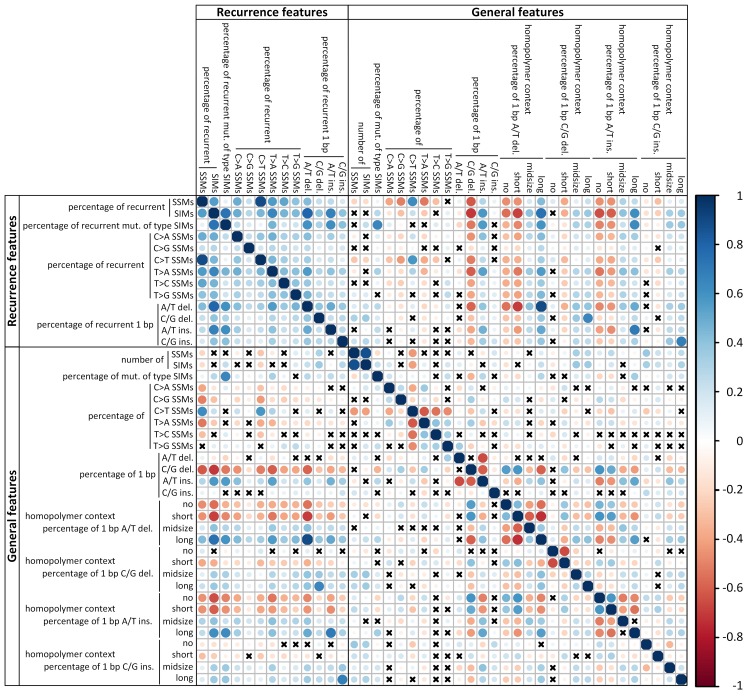
Fig 2. Spearman’s rank correlation between the 42 mutational features.
The colour of the circles indicate positive (blue) and negative (red) correlations, colour intensity represents correlation strength as measured by the Spearman’s rank correlation coefficient. The size of the circle indicates the adjusted p-value with larger circles corresponding to lower p-values. The p-values were corrected for multiple testing using the Benjamini-Yekutieli method. Crosses indicate that the correlation is not significant (adjusted p-value > 0.05).

