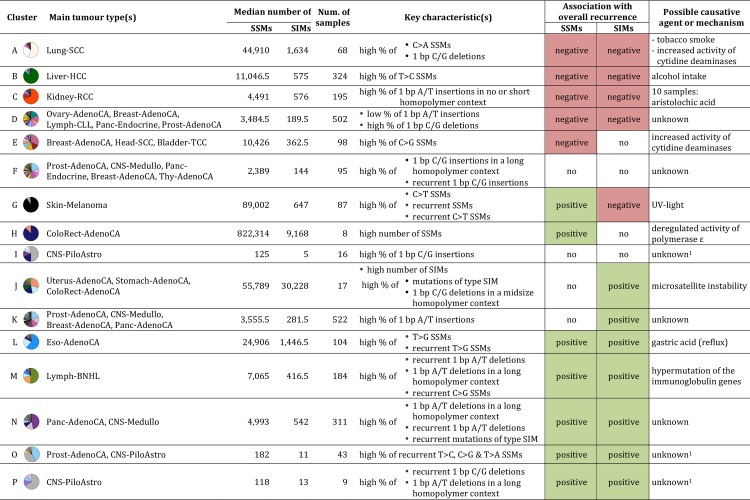
Fig 4. Key characteristics of the 16 clusters.
Tumour types that form together ≥50% of the cluster are listed. The legend for colours for the pie chart is provided in Fig 3. The key characteristics are those features with the strongest significantly negative or positive association with the cluster. Only if the association with overall recurrence is significant, the respective direction is indicated. 1Cluster has a low median number of SSMs (<200) and SIMs (<20).

