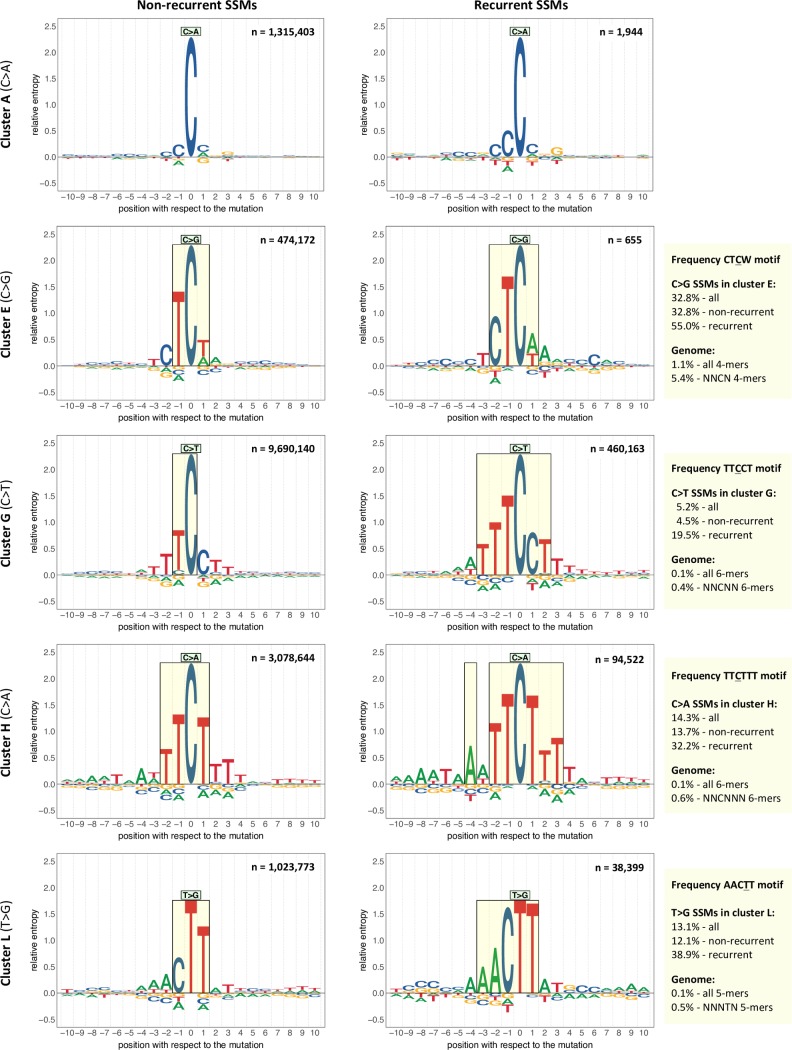
Fig 6. Enriched sequence motifs.
The sequence logos represent the sequence context of ten bp 5’ and 3’ of the non-recurrent (left-side) or recurrent (right-side) mutations of the indicated cluster and SSM subtype. Here recurrence is defined as a mutation at the same genomic location in two or more samples from the same cluster. Each recurrent SSM is included only once to avoid giving extra weight to highly recurrent mutations. Relative entropy is used as a measure of information content (see Methods). Setting a threshold of 0.25 for the relative entropy results in the motifs highlighted in the rectangles. In the upper right corner of each sequence logo the number of mutations is indicated. To the right of the sequence logos are the percentages in which the enriched motif found for the recurrent SSMs is present in context of the mutations in the cluster and the corresponding k-mers in the genome (N = A, C, G or T). The enrichment for the motif for recurrent SSMs is in all four cases significantly higher than for the non-recurrent SSMs (χ2 test: p<2.2e-16).

