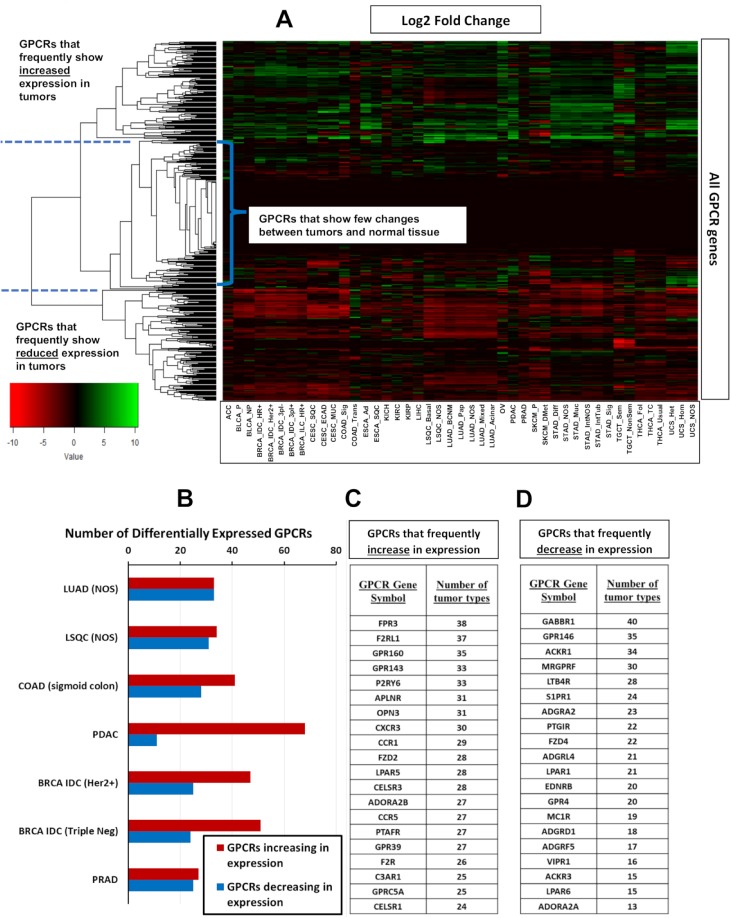
Fig 1. Heatmaps of GPCR expression and DE in solid tumors.
(A) For all 45 tumor subtypes, a heatmap showing the log2 fold-change of GPCR expression in tumors compared to normal tissue (positive values indicate higher expression in tumors), with hierarchical clustering of GPCR genes to reveal patterns of DE. (B) The number of GPCRs that show significant (FDR < 0.05) changes in expression compared to normal tissue among tumor types tested with large numbers of replicates (Table 1) and that correspond to the most lethal types of cancer. (C–D) The GPCRs that most frequently (i.e., in most tumor types) show increases (C) or decreases (D) in expression among the 45 tumor subtypes. DE data for GPCRs in all analyzed tumor types can be found in S2 Table, sheets 6–8. BRCA, breast cancer; COAD, colon adenocarcinoma; DE, differential expression; FDR, false discovery rate; GPCR, G protein-coupled receptor; Her2, Human Epidermal Growth Factor Receptor-2; IDC, Infiltrating Ductal Carcinoma; LSQC, lung squamous cell carcinoma; LUAD, lung adenocarcinoma; NOS, Not Otherwise Specified; PDAC, pancreatic ductal adenocarcinoma; PRAD, Prostate Adenocarcinoma.

