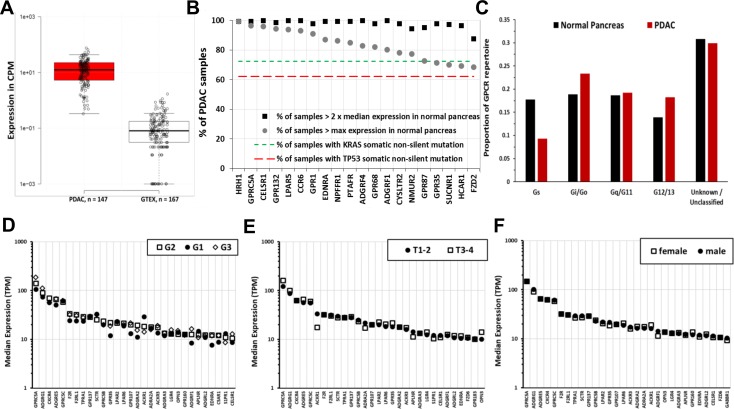
Fig 3. Increased expression of certain GPCRs in PDAC is more frequent than that of KRAS and TP53 mutations; is independent of tumor grade, pathological T, and patient sex; and includes GPCRs that couple to each of the 4 major G protein families.
(A) The expression of GPRC5A in all PDAC samples and normal pancreas tissues analyzed. (B) Frequency of 2-fold increase and percent of TCGA-PDAC samples with higher maximal expression compared to normal pancreas of the indicated GPCRs with comparison of the frequency of mutations of KRAS and TP53, the most frequent somatic, nonsilent mutations in PDAC tumors in TCGA. (C) Changes in GPCR expression in PDAC alter the GPCR repertoire that couple to different G proteins. (D–F) Tumor grade (D), pathological T (E), and patient sex (F) do not impact on GPCR expression. The 30 highest expressed GPCRs in PDAC tumors are shown for each case; no statistically significant differences occur between the groups. The numerical values used to generate panels A–F can be found at https://insellab.github.io/data. CPM, Counts Per Million; GPCR, G protein-coupled receptor; GTEx, Gene Tissue Expression Project; PDAC, pancreatic ductal adenocarcinoma; TCGA, The Cancer Genome Atlas; TPM, Transcripts Per Million.

