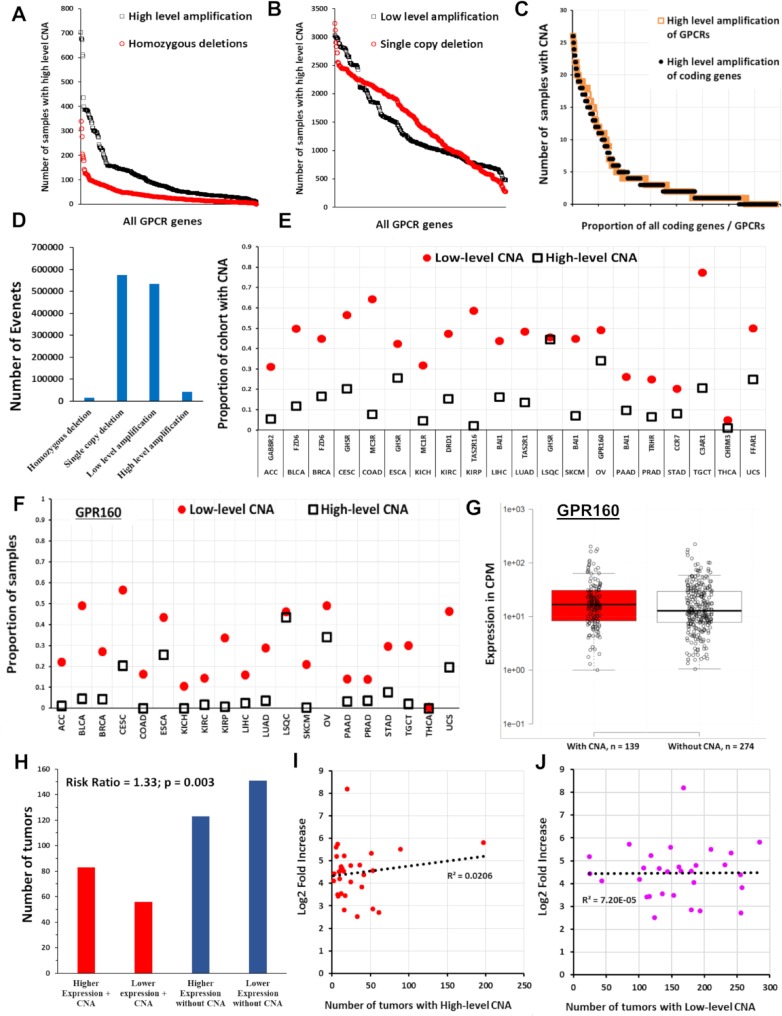
Fig 13. CNVs of GPCRs in solid tumors.
(A) The number of solid tumors with CNV for each GPCR across all TCGA samples (plotted in descending order of frequency for high-level amplification and homozygous deletions; see text for definition of high- and low-level amplification). (B) The same as in (A) for low-level amplification and single-copy deletions. (C) In SKCM tumors (n = 367), the distribution of high-level amplification of GPCRs (n = 390 genes) compared to that of all protein coding genes (n = 24,776). (D) The total number of homozygous deletions, single-copy deletions, and low-level and high-level amplifications for all GPCRs combined in the 7,545 TCGA tumors surveyed for CNV. (E) The most frequently amplified GPCR for each TCGA tumor type and the proportion of samples with high and low-level amplification for that GPCR. (F) Proportion of samples of various tumors types with high and low-level amplification of GPR160, the most frequently amplified GPCR overall). (G) OV samples with and without high-level amplification of GPR160, with the median for each group indicated. The difference between groups was not statistically significant). (H) The risk ratio of elevated GPR160 expression (above the median value for OV) when GPR160 also shows high-level amplification; amplification of GPR160 increases the likelihood that GPR160 expression is elevated. (I) For the 30 GPCRs in OV with the highest fold-increase in expression relative to normal ovarian tissue (with FDR < 0.05 and median expression in OV > 1 TPM), the corresponding number (of 579) OV tumors with high-level amplification of those same GPCRs. (J) The same as (I) but comparing fold-increase against low-level amplification. Numerical values used to generate all panels of this figure can be found at https://insellab.github.io/data. CNA, copy number amplification; CNV, copy number variation; GPCR, G protein-coupled receptor; OV, ovarian cancer; SKCM, skin cutaneous melanoma; TCGA, The Cancer Genome Atlas; TPM, Transcripts Per Million.

