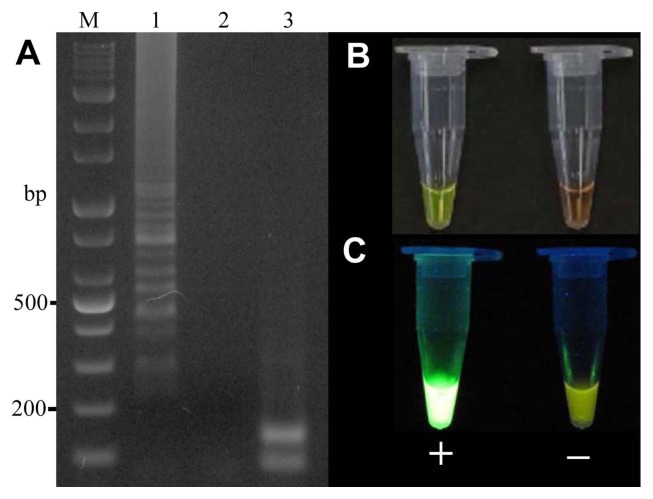
Fig. 3.
Electrophoresis of the loop-mediated isothermal amplification (LAMP) products and the LAMP products digested with the HaeIII restriction enzyme. (A) Gel-imaging analysis of the LAMP product. M: 1 kb plus DNA ladder; Lanes 1–3 indicate positive control, negative control, and LAMP products digested with HaeIII, respectively. (B, C) Visual analysis after the addition of SYBR Green I using the naked eye and a UV illuminator, respectively.

