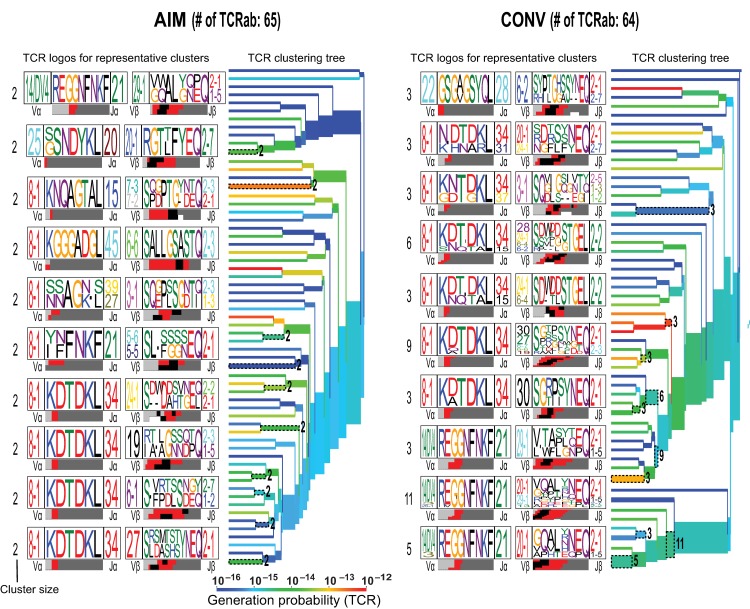
Fig 3. Hierarchical clustering of TCRs highlights the structural features required for interaction with pMHC of paired TCRα/β.
(A-B) Hierarchical TCRαβ clustering along with corresponding TCR logos for YVL-BR-specific CD8 T-cell responses in AIM (A) and CONV (B). Number on the branches and next to TCR logos depicts number of TCRs contributing to the cluster. Color of the branches indicates the TCR probability generation scores. The bar at the bottom of the CDR3 logo is color-coded by the source of the nucleotide. Light grey, red, black, and dark grey denote that the nucleotides encoding those amino acid residues originate from the V, N, D and J regions, respectively. Analyses are based on Dash et al. [20].

