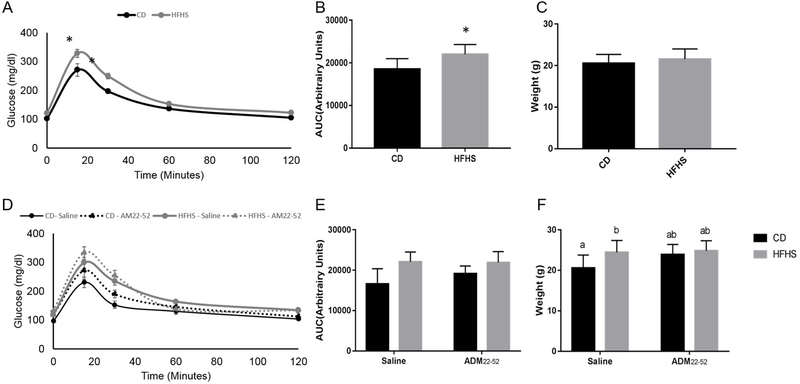
Figure 2.
Glucose tolerance and body weight in mice under CD or HFHS diets. (A) Glucose tolerance, (B) IPGTT AUC and weights (C) in mice following 4 weeks CD or HFHS diet feeding before ADM22–52 treatment. (C) Glucose tolerance, (D) IPGTT AUC and (E) weights following 8 weeks CD or HFHS diet feeding with or without ADM22–52 treatment. Data displayed as mean+/−SEM with * and different letters indicating significant differences between groups (p<0.05).

