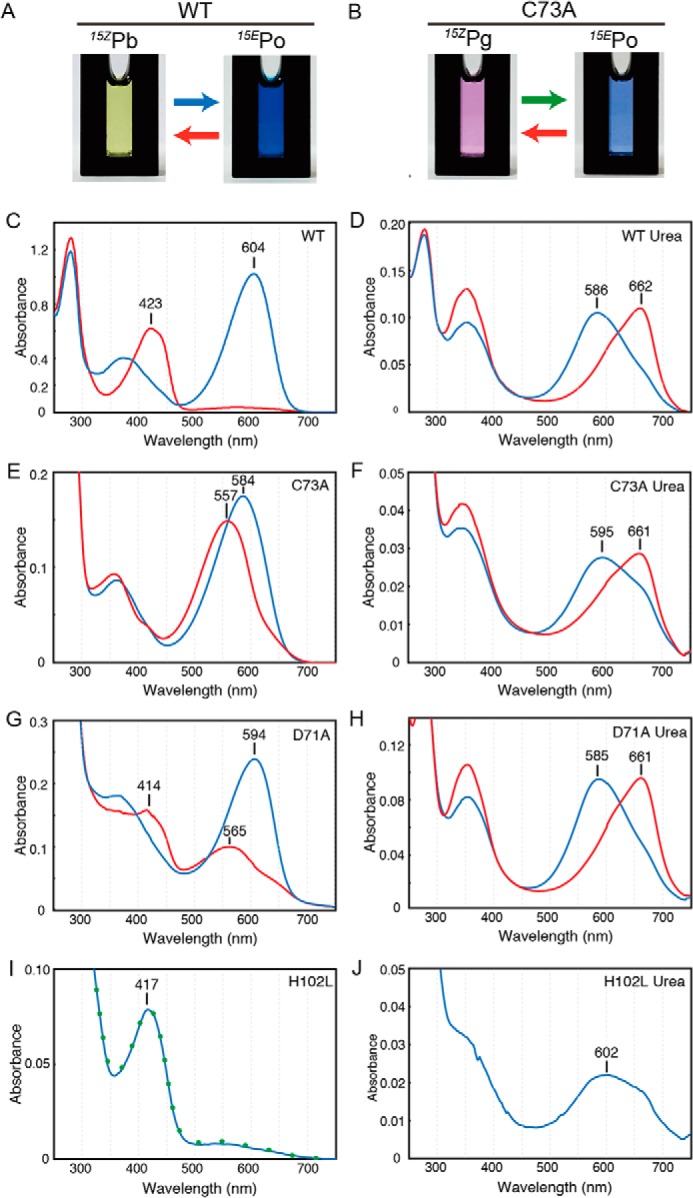
Figure 2.

Spectral characterization of WT and single amino acid variants. Photographs of protein solution of WT undergoing blue/orange photocycle (A) and C73A variant undergoing green/orange photocycle (B) are shown. C–J, native absorption spectra of WT (C), C73A (E), D71A (G), and H102L (I) and acid-denaturation absorption spectra of WT (D), C73A (F), D71A (H), and H102L (J). For H102L, absorption after blue light illumination was also included as a green dot (I). Spectra corresponding to the 15Z state (red) or 15E state (blue) of the bilin were indicated.
