Figure 7.

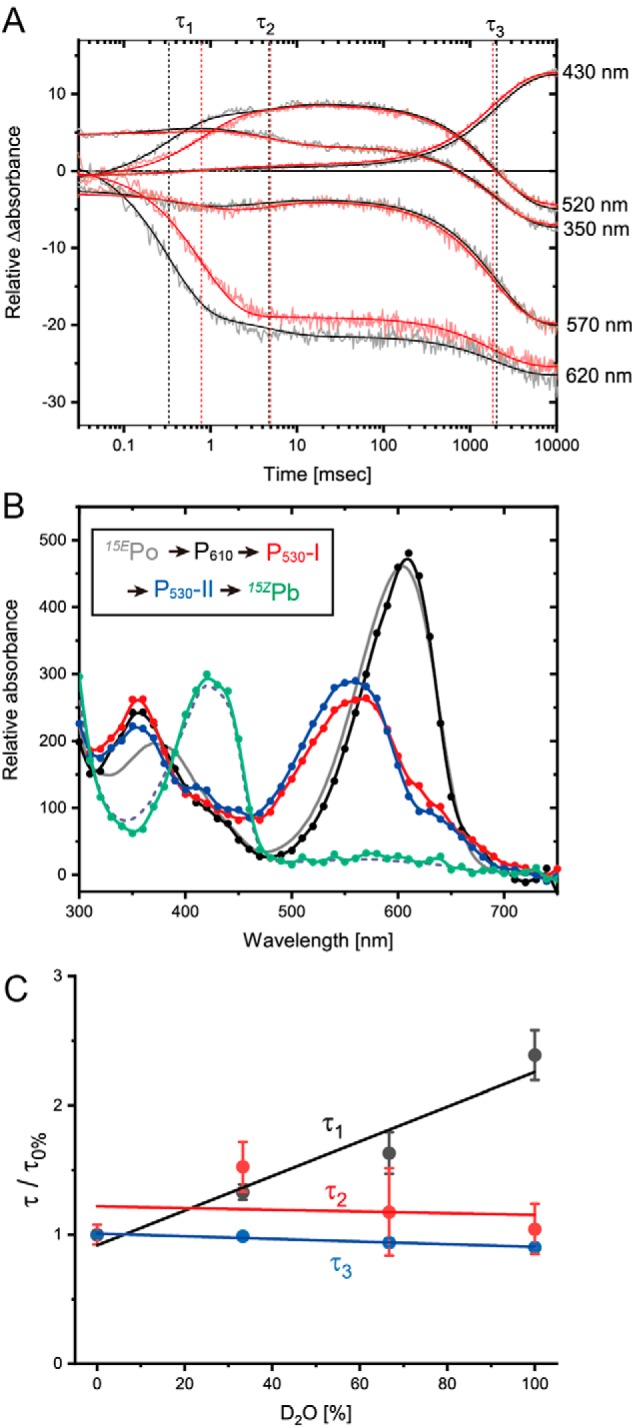
Time-resolved spectroscopy of the reverse photocycle. A, time trace of the absorption changes at selected wavelengths from 15EPo to 15ZPb conversion. Absorption changes were monitored for the samples in the buffer containing 100% H2O (black) or 100% D2O (blue). These traces were fitted with three exponentials (solid line). Time constants τ1, τ2, and τ3 are shown as vertical dotted lines. B, absorption spectra of three intermediates P610 (black), P530-I (red), and P530-II (blue) and the final product (green), which was calculated by the subtraction of absorption changes from the initial 15EPo spectrum (gray, solid line). The good agreement between the final product (green) and 15ZPb spectra (gray, dashed line) demonstrated that the final product corresponds to 15ZPb. C, effect of the H2O/D2O ratio on the time constants τ1, τ2, and τ3.
