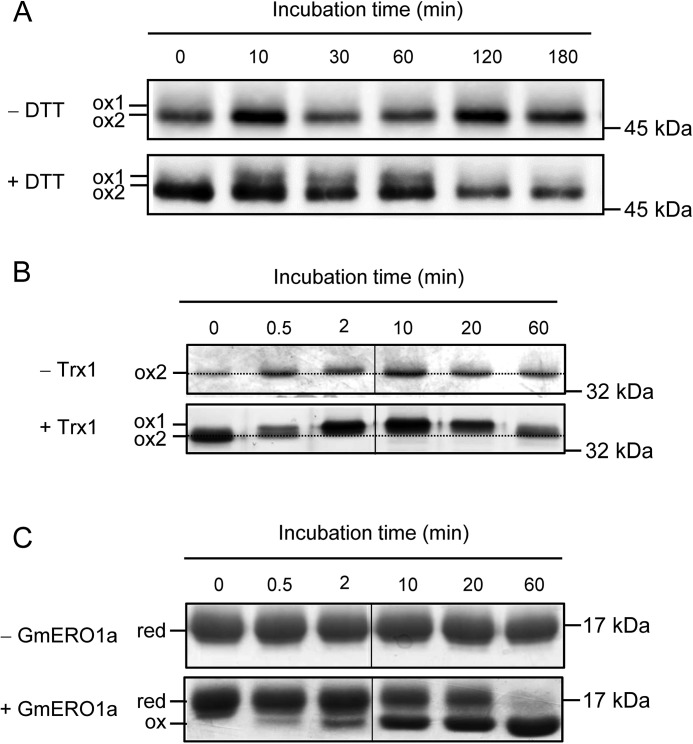
Figure 2.
Change in GmERO1a redox status. A, cultured soybean cells (DG330) were incubated with or without 1 mm DTT at 25 °C. Change in GmERO1a redox status was analyzed by nonreducing SDS-PAGE and Western blotting using anti-GmERO1 serum after N-ethylmaleimide treatment of the proteins extracted from cultured soybean cells. B and C, change in GmERO1a (B) and Trx1 (C) redox status during oxidation catalyzed by GmERO1a was analyzed by nonreducing SDS-PAGE after alkylation with N-ethylmaleimide (B) and 4-acetamido-4′-maleimidylstilbene-2,2′-disulfonic acid (C) treatment. Proteins were stained with silver-staining (B) or Coomassie Brilliant Blue G-250 (C). B, dotted line indicates the position of ox-2 band. C, red, reduced Trx1; ox, oxidized Trx1.

