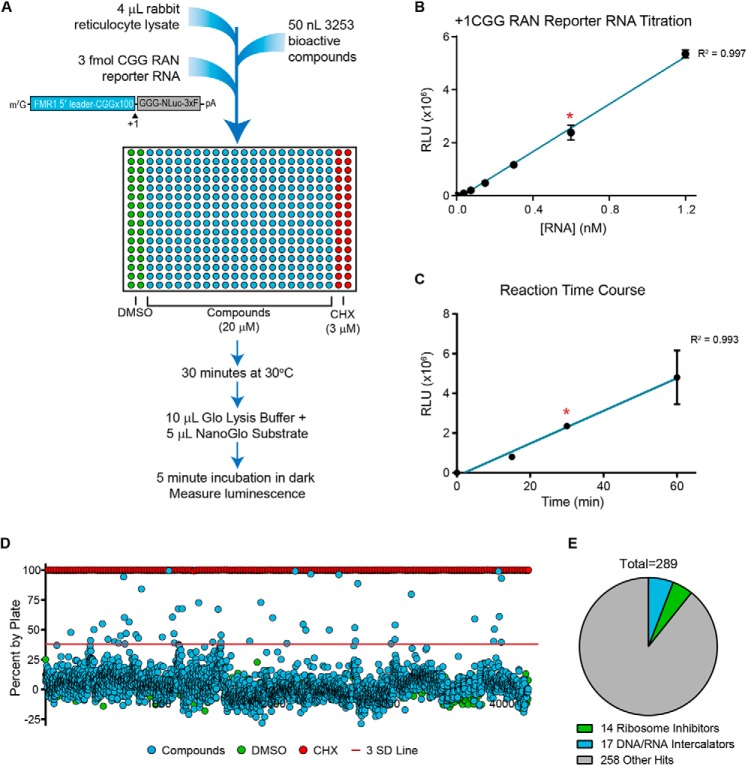
Figure 1.
Screen of 3,253 bioactive compounds for inhibitors of RAN translation. A, schematic of primary screen design. In each plate, DMSO (columns 1 and 2) served as an internal negative control, and 3 μm cycloheximide (CHX; columns 23 and 24) served as an internal positive control for translation inhibition. Compounds screened were from the Pilot LOPAC, Pilot Prestwick, Pilot NCC-Focused, and Navigator Pathways libraries. 3xF, 3xFLAG tag. B, linear relationship between +1CGG RAN reporter mRNA concentration and luminescence for in vitro translation assay under conditions used for primary screen. C, linear relationship between reaction time and luminescence for in vitro translation assay with 3 fmol of +1CGG NLuc RAN reporter mRNA under conditions used for the primary screen. For B and C, teal lines represent linear regression fit, with a red asterisk indicating conditions used in the screen. Each point represents the mean of n = 3. Error bars, S.D. D, percentage change in NLuc signal for all 3,253 compounds relative to the DMSO vehicle controls. The red line approximately represents 3 S.D. values from vehicle controls. E, pie chart of screen hits, indicating the proportion of hits that are known ribosome inhibitors or DNA/RNA intercalators.

