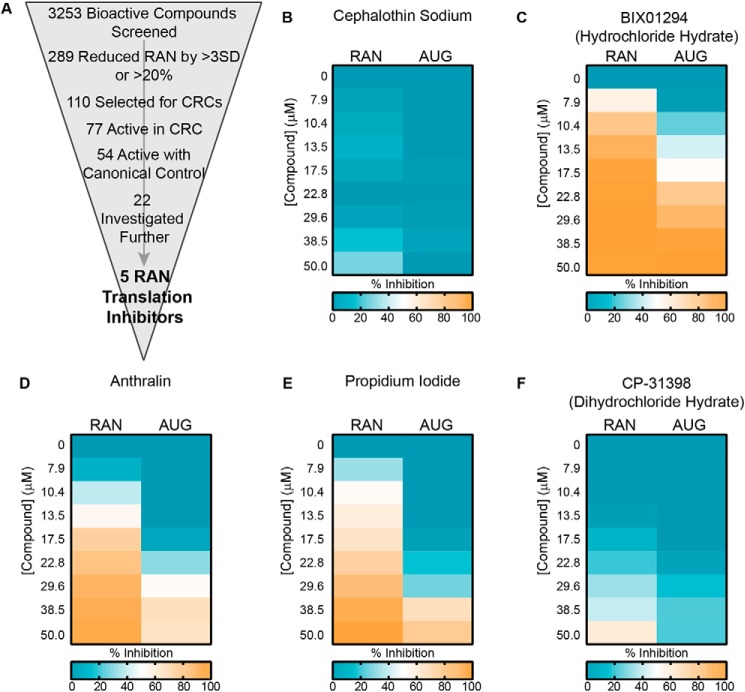
Figure 2.
Concentration-response curves and counterscreen. A, schematic of screen work flow, with the number of hits at each step indicated. CRC, concentration-response curve. B, representative heat map of a “RAN-specific inhibitor,” cephalothin, showing percentage inhibition of +1CGG RAN translation and canonical AUG translation at the indicated concentrations. C–F, representative heat maps of “RAN-selective inhibitors,” showing percentage inhibition of +1CGG RAN translation and canonical AUG translation at the indicated concentrations. For B–F, heat map values are the average of duplicate reactions. For visual clarity, effects of <0% inhibition (increases) were set to zero.

