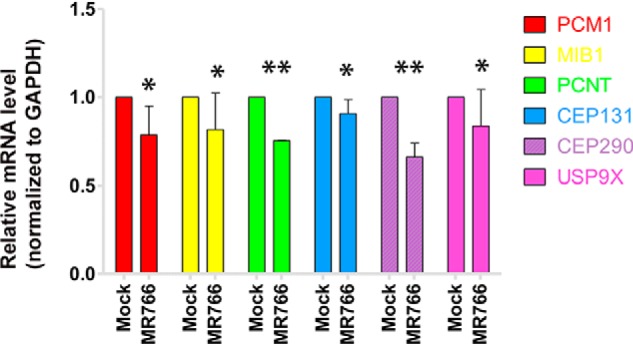
Figure 10.

Real-time RT-PCR to determine the levels of PCM1 and Mib1. 1.25 μg of total RNA was used for each RT-PCR to examine the levels of PCM1, Mib1, PCNT, CEP131, CEP290, USP9X, and GAPDH using the primers shown in Table 1. The experiments were performed independently two times, and the average mRNA levels were normalized with that of GAPDH. *, p > 0.05; **, p < 0.001. Error bars, S.E.
