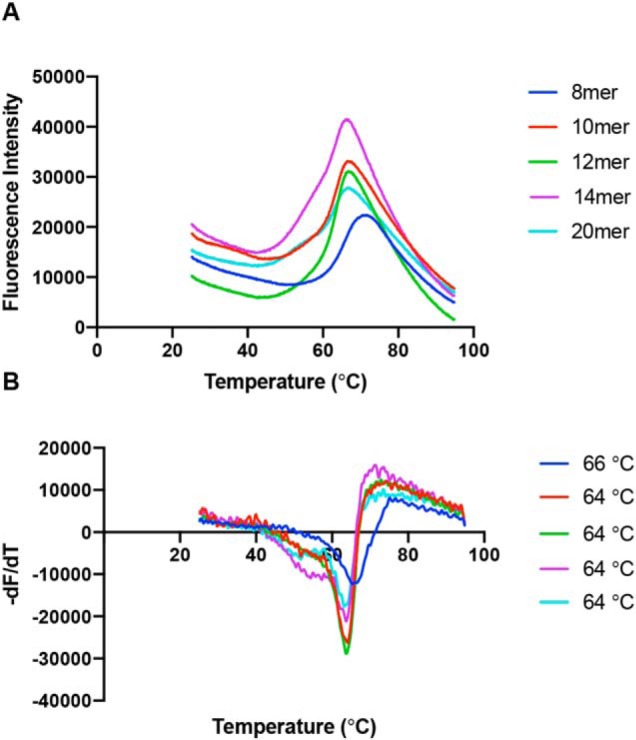
Figure 4.

Thermal denaturation assay. A, averaged thermal denaturation curves for individual peptides, as indicated, presented by HLA-B*0801E76C. B, graphs of the first derivative of the curves shown in A. The Tm values, determined from the minima, are indicated for each peptide. The Tm value of each complex was unchanged with different refolding batches.
