Figure 3.
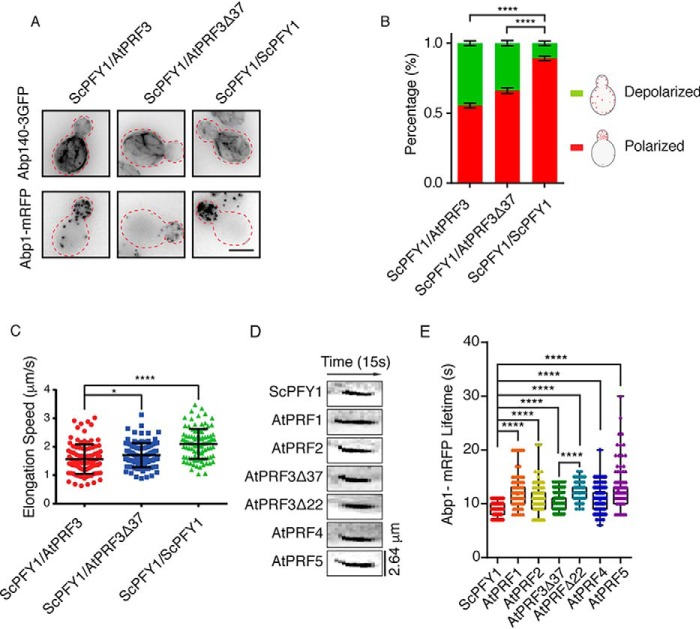
In vivo function comparison of AtPRFs in budding yeast. A, maximum intensity Z-projection images of actin cables and patches in heterozygous diploids, ScPFY1/AtPRF3, ScPFY1/ AtPRF3Δ37, and ScPFY1/ScPFY1. Scale bar, 5 μm. B, visual scoring the polarity of actin patches in diploid cells. (6 individual images were analyzed, and more than 200 total yeast cells were classified). C, actin cables motility in heterozygous diploid strains ScPFY1/AtPRF3, ScPFY1/ AtPRF3Δ37, and ScPFY1/ScPFY1 (n = 100 filaments). p values were determined by two-tailed Student's t test assuming equal variances (*, p < 0.05; ****, p < 0.0001). Error bars, S.D. D and E, representative kymographs (D) and lifetimes of Abp1-mRFP patches (E) in the indicated haploids. From left to right, n = 125, n = 120, n = 120, n = 126, n = 147, n = 122, and n = 122 patches used for analysis.

