Figure 7.
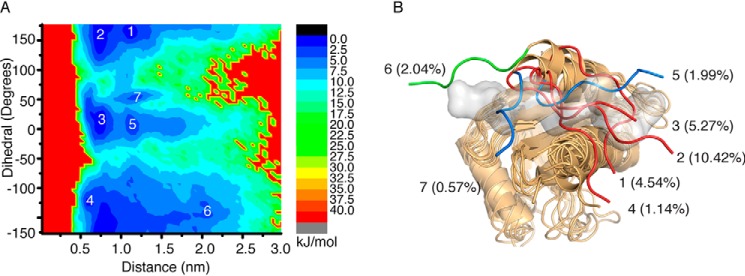
Computational simulation analysis of AtPRF3 NTE. A, free-energy surface as a function of dihedral angle formed by α carbons of residues 36–39 (dihedral) of AtPRF3Δ22M2 against center of mass distance between the NTE and C-terminal helix (distance), which describes the conformational space of AtPRF3 NTE. The local minimum is labeled with numbers. B, all the conformations corresponding to the minimum in A of the AtPRF3 NTE are superimposed onto the crystal structure of Poly-P–bound (gray surface) AtPRF2. Seven local minima are indicated. The percentage of each minimum is the ratio between the number of structures in the representative class and the total sampling data.

