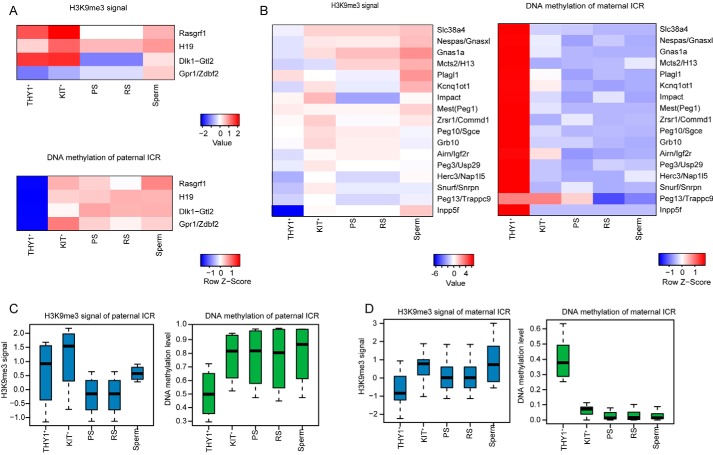
Figure 5.
Dynamics of H3K9me3 modification and DNA methylation at gICRs during mouse spermatogenesis. A, heat maps showing the H3K9me3 and DNA methylation of paternal gICRs. B, heat maps showing the H3K9me3 and DNA methylation of maternal gICRs. C, box plots showing the H3K9me3 and DNA methylation signals of paternal gICRs. D, box plots showing the H3K9me3 and DNA methylation signals of maternal gICRs.

