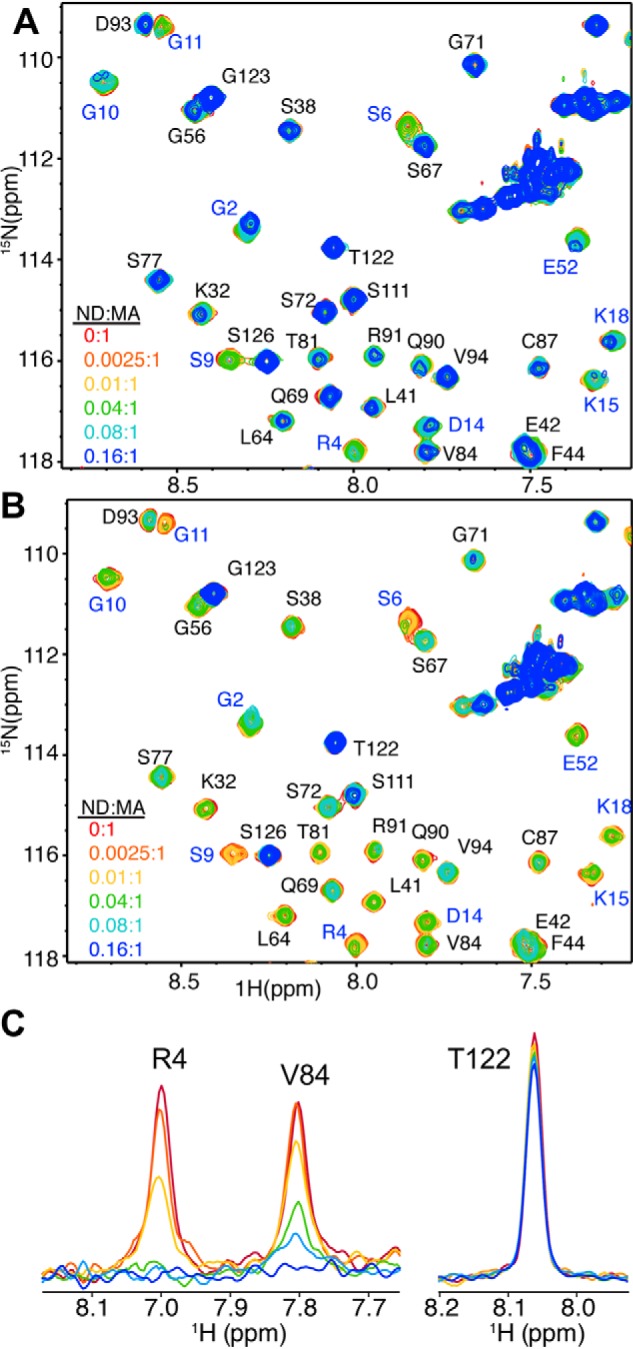
Figure 1.

NMR spectra of MA upon titration with NDs. A and B, selected regions of 2D 1H-15N HSQC spectra obtained for 15N-labeled samples of MA at 100 μm in the presence of 0 (red), 0.0025 (orange), 0.01 (yellow), 0.04 (green), 0.08 (cyan), and 0.16 (blue) molar equivalents of POPC:POPS (80:20) NDs (A) and POPC:POPS:PI(4,5)P2 (72:20:8) NDs (B). C, 1D slices of representative cross-peaks from B showing the decrease in signal intensity upon the addition of POPC:POPS:PI(4,5)P2 (72:20:8) NDs.
