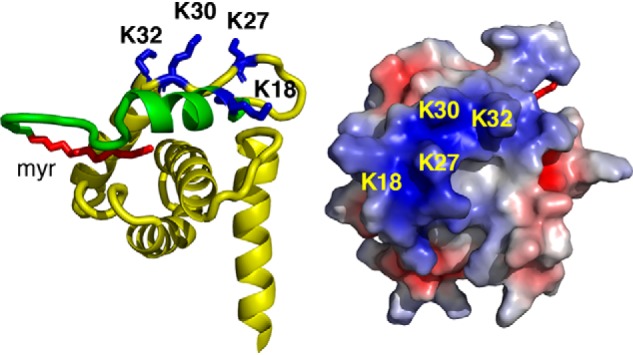
Figure 2.

MA-ND interaction interface. Shown are a cartoon representation (left) and electrostatic map (right) of the HIV-1 MA structure (PDB code 2H3I) highlighting basic residues in the HBR (blue) and the N-terminal helix (green) that exhibited substantial loss in signal intensity and/or CSPs upon binding to POPC:POPS:PI(4,5)P2 NDs. The myr group is shown in red. Residues 116–132 are not shown for clarity.
