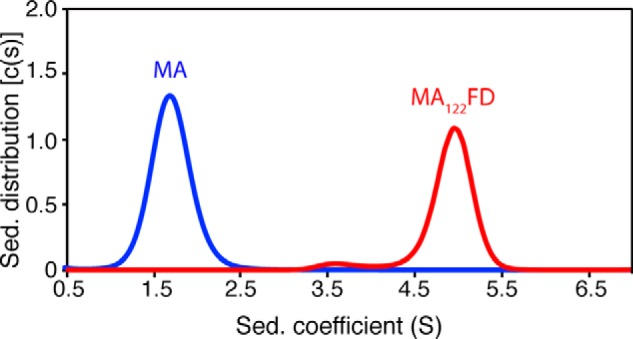
Figure 5.

Sedimentation velocity of MA proteins. Shown are sedimentation coefficient distributions (c(s)) versus sedimentation coefficient (s) obtained from the sedimentation profiles of MA and MA122FD. Molecular weight distribution analysis indicates a largely monomeric MA and trimeric MA122FD species. Proteins were run using a buffer containing 50 mm sodium phosphate (pH 6.0) and 50 mm NaCl.
