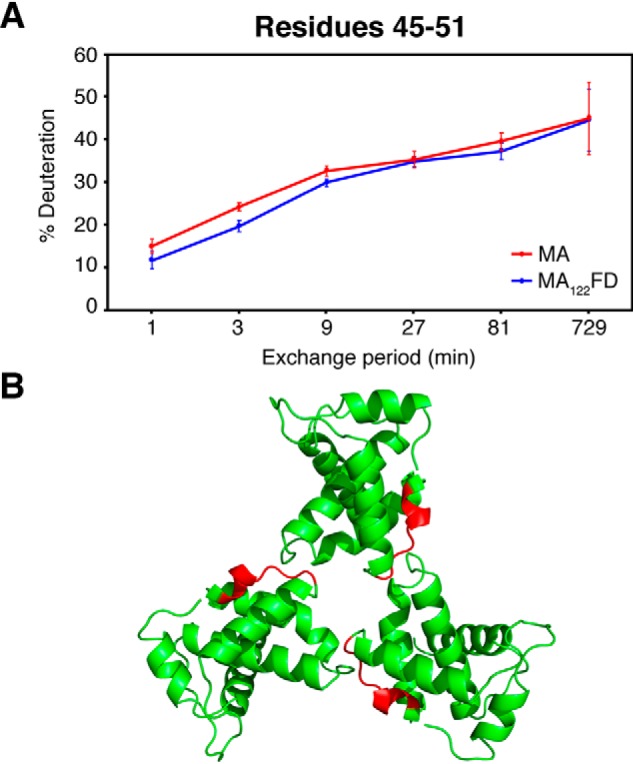
Figure 7.

HDX-MS data of MA and MA122FD. A, deuterium exchange profile for residues 45–51 of MA and MA122FD at various time points. Points and error bars represent the average values and 95% confidence intervals calculated from six independent HDXMS experiments. B, cartoon representation of the HIV-1 MA crystal structure (PDB code 1HIW) with residues 45–51 highlighted in red located at the MA-MA interface.
