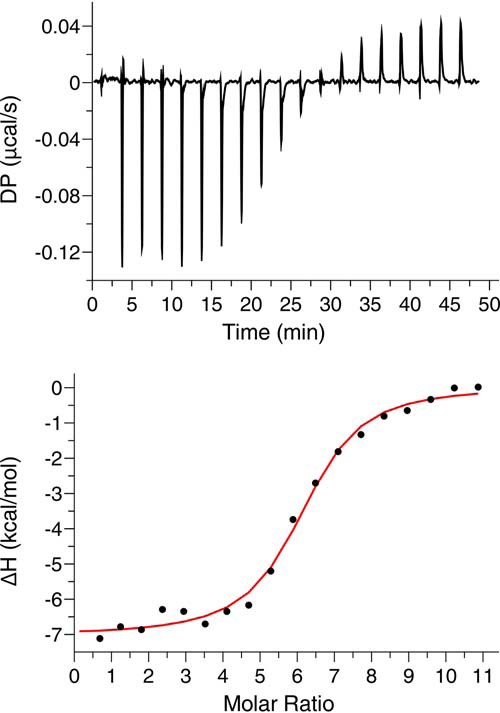
Figure 8.

ITC analysis of MA trimer binding to NDs. Shown are ITC data obtained for titration of MA122FD-Fab (152 μm) into POPC:POPS:PI(4,5)P2 (75:20:5) NDs (2.7 μm). The top panel shows the baseline-adjusted thermogram, and the bottom panel depicts the binding isotherm and fit to the data (red line).
