. 2019 Nov 18;8:e46351. doi: 10.7554/eLife.46351

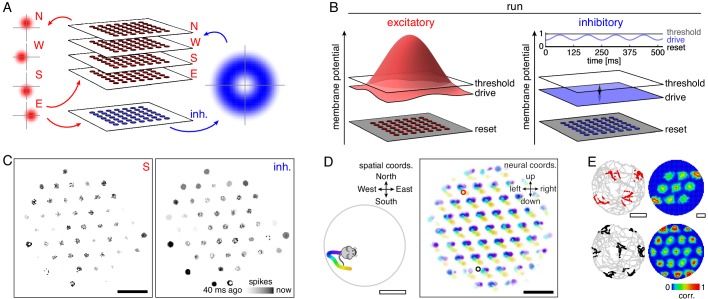
Figure 1. Model architecture and generation of 2D grid cells.

(A) Our model consists of a neural sheet with five overlapping populations, four of them excitatory—N, W, S, and E—and one inhibitory. Each density plot depicts the synaptic outputs in the sheet of a neuron at the origin. (B) Each neuron is driven to a particular membrane potential, which exceeds the spiking threshold for excitatory neurons at the center of the sheet and oscillates at 8 Hz for inhibitory neurons while the animal is running. (C) Snapshot of neural activity showing S and inhibitory populations separately; other excitatory populations have activity patterns similar to that of the S population. Each pixel is a neuron and dark colors indicate recent spiking. (D) Left, segment of a 2D open field trajectory. Right, neural activity over the course of the segment with each neuron colored according to the position at which it attained its maximum firing rate. Each attractor bump moves in synchrony with animal motion. (E) Left, two sample grid cells with spikes shown as colored dots superimposed on the animal’s trajectory. Each neuron’s location in the sheet is indicated by a circle of corresponding color in D. Right, autocorrelation of rate maps calculated from spikes at left. Black scale bars, 50 neurons. White scale bars, 50 cm.

Figure 1.

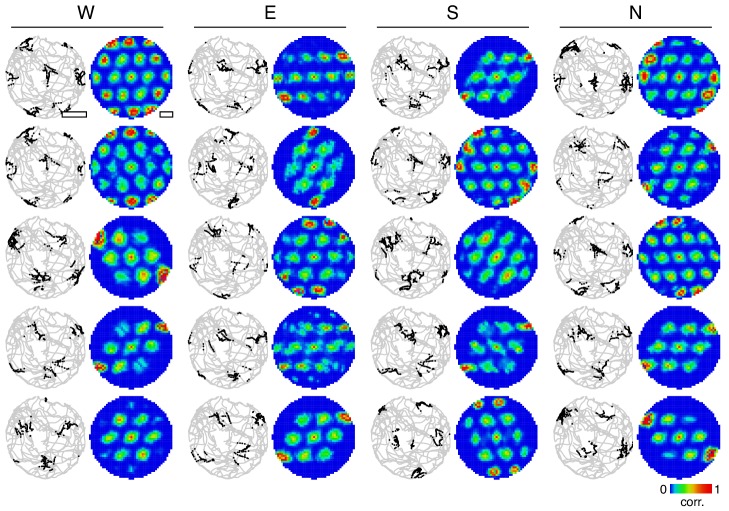
Figure 1—figure supplement 1. 2D firing maps for many grid cells.

Figure 1—figure supplement 1.

Spatial firing maps for a 2D open field trajectory. Twenty grid cells are selected from the simulation depicted in Figure 1D,E across all four excitatory populations. For each grid cell, spikes superimposed on the animal’s trajectory (left) and autocorrelation of rate maps calculated from spikes (right).
Figure 1—video 1. Emergence of a grid-like pattern on the neural sheet from randomly initialized membrane potentials.
Download video file (1.5MB, mp4)
Neural activities of the W and inhibitory populations over the first 240 ms of simulation setup. Each pixel is a neuron, with black corresponding to current spikes and lightest gray corresponding to spikes 40 ms ago. Defects in the grid are then removed as described in the Model details subsection of Appendix 1 before the main simulation begins.
Figure 1—video 2. Path integration over an open field trajectory produces 2D grid cells.
Download video file (2.1MB, mp4)
Left, neural activity of the W population. Each pixel is a neuron, with black corresponding to current spikes and lightest gray corresponding to spikes 40 ms ago. Red circle indicates the location of a single recorded neuron. Right, open field trajectory in an enclosure of diameter 1.8 m with a black square indicating the current animal position. Red dots indicate animal positions during spikes recorded from the neuron.