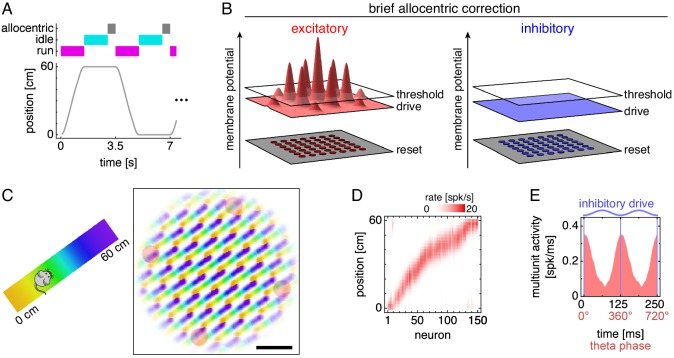
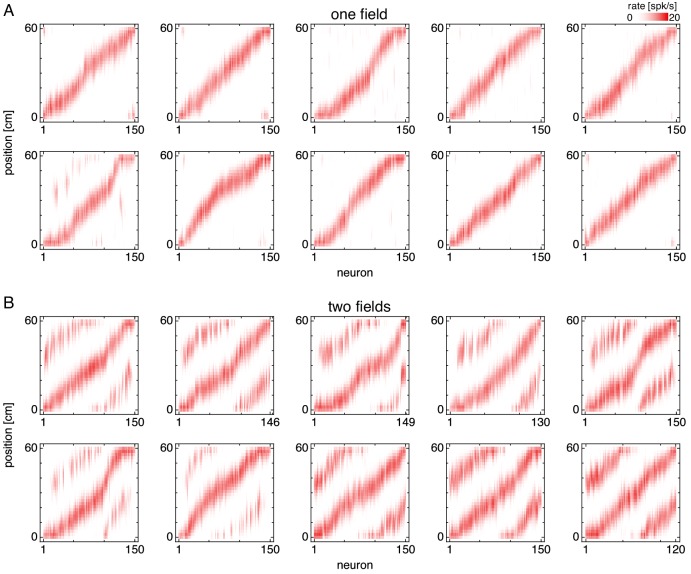
Figure 2. Grid cells along a 1D track.
(A) Trajectory consisting of runs along a track separated by idle periods at either end. Between the end of an idle period and the start of a run, the network receives brief allocentric input. (B) Allocentric input corrects the location of attractor bumps on the neural sheet (Materials and methods). (C) Left, track diagram. Right, neural activity over runs with each neuron colored according to the track position at which it attained maximum firing rate. Red circles indicate regions of recording. Scale bar, 50 neurons. (D) Firing fields of recorded grid cells sorted by position of maximum rate. (E) Multiunit activity of neurons in D averaged over theta cycles, which span from one trough of the oscillating inhibitory drive to the next. Data is repeated over two cycles for clarity.


