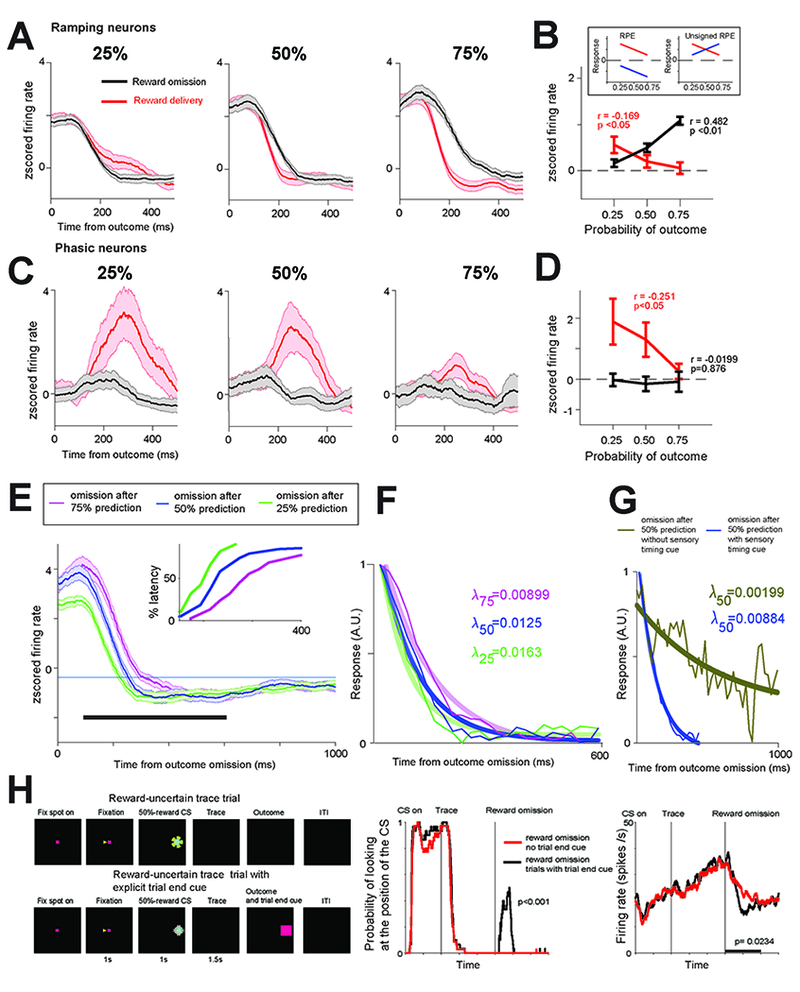
Figure 2 -. Differential coding of surprise in ramping and bursting BF neurons.

(A) Ramping neurons’ average outcome activity in 25%, 50% and 75% conditions. Red – reward delivered trials; black – no reward trials. (B) Ramping neurons’ average responses for reward delivery and no reward trials. Linear correlations of responses with reward expectancy are indicated (time window: 100ms to 400ms; p values were obtained with 10,000 permutations; Methods). The results of the correlations suggest that the activity resembles the toy model of unsigned RPE (or surprise). Inset shows cartoon models of theoretical outcome responses coding reward prediction errors (RPE; left) and unsigned RPE (right). If neurons signal unsigned reward prediction errors, then they should display greatest responses to reward deliveries following 25% reward predictions, and smallest responses following a 75% reward prediction. The same neurons should display greatest responses to reward omissions following 75% reward predictions, and smallest responses following 25% reward predictions. Alternatively, if neurons encode signed RPEs, then they will display inhibitions following omissions whose magnitude ought to be inversely related to the probability of reward. (C) Outcome activity of phasic bursting neurons. Conventions are the same as in (A). (D) Phasic bursting neurons’ responses resembled reward prediction error coding only in reward delivery trials (red; time window: 200ms to 500ms). (E) Activity of BF ramping neurons during 25, 50, and 75% reward probability trials in which the reward was omitted. The ramping activity returned to inter-trial baseline level (thin blue line) at different latencies across these three types of trials: earliest during 25% trials, and latest during 75% trials. Cumulative distributions of these latencies are shown in the inset. (F) Exponential fits (thick lines) to the population binned activity (thin lines; Methods). Fits and decay rates (right) were calculated for the population after the activity for each trial type was normalized from 0 to 1, such that for each of the tree conditions, the starting point is 1. (G) Same as F, except here we compared fit and decay rate during 50% trials in which an explicit cue indicated the end of the trial (dark blue) with fit and decay rate during 50% trials in which no explicit cue was given (and the CS remained on the screen; Methods). (H-left) Trace conditioning with and without explicit visual cues that signaled the end of the trial. (H-middle) Monkey’s gaze behavior indicated that it attended to the trial-end cue (presented at the same location as the CS; rank sum test; p<0.001). (H-right) Explicit knowledge of trial timing reduced the reward-omission related ramping activity (Monkey W; 8 neurons; p=0.0234; sign rank test). Analysis window used to study gaze behavior and neuronal activity is indicated by black bar. See also Figure S3 for activity in the temporal uncertainty procedure separately.
