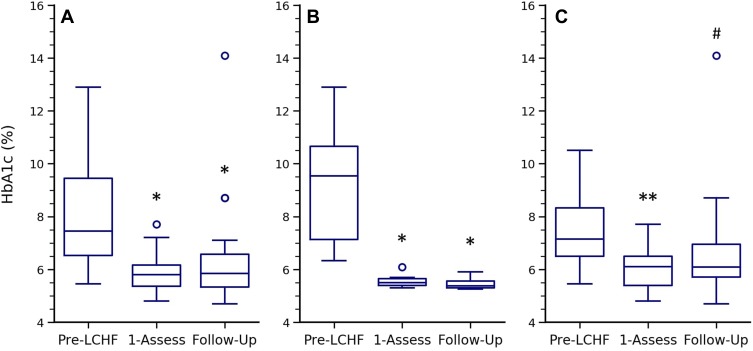
Figure 3.
Change in HbA1c over time. HbA1c expressed as median, interquartile ranges, and outliers at Pre-LCHF, First-Assessment and Follow-Up for: (A) all participants with valid HbA1c records at these three timepoints (n = 22, p < 0.01); (B) the subset of participants who started LCHF shortly after diagnosis (Pre-LCHF is equivalent to Diagnosis) (n = 6, p < 0.01); and (C) the subset of participants who were receiving conventional T2D management prior to starting an LCHF diet (n = 16, p = 0.03). P values were determined using the Friedman test. *and **Indicates a significant difference to Pre-LCHF (p < 0.05 and <0.01 respectively); #Indicates that the p value for the difference between Pre-LCHF and Follow-Up changes from 0.08 to 0.02 if analyzed without the 14.1% outlier. Post hoc p values were determined using the unadjusted pairwise Wilcoxon post-hoc test.

