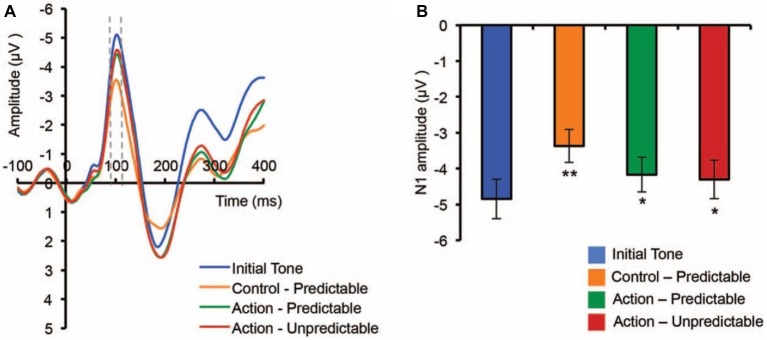
Figure 1.
Grand-averaged ERPs across the Fz and FCz electrodes showing attenuated N1 response for an event that is caused by one’s action. (A) shows the EPRs time-locked to the onset of the one. (B) shows the amplitude of N1 in each condition. Original figure from Bednark et al. (2015). Permission was not required according to APA Permissions Policy.

