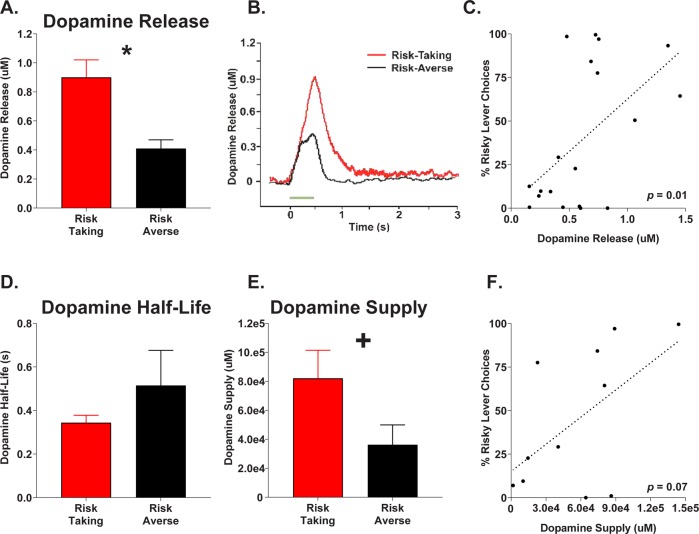
Fig. 3.
Nucleus accumbens shell evoked dopamine release and dopamine supply in risk-taking and risk-averse subpopulations. a Mean evoked dopamine release. b Sample evoked dopamine waveforms in risk-taking and risk-averse rats. c Correlation between total risk preference and dopamine release across all subjects. d Mean dopamine half-life in risk subpopulations. e Mean dopamine supply in risk subpopulations. f Correlation between risk preference and dopamine supply. Error bars represent ±SEM. *p < 0.05; +p < 0.8

