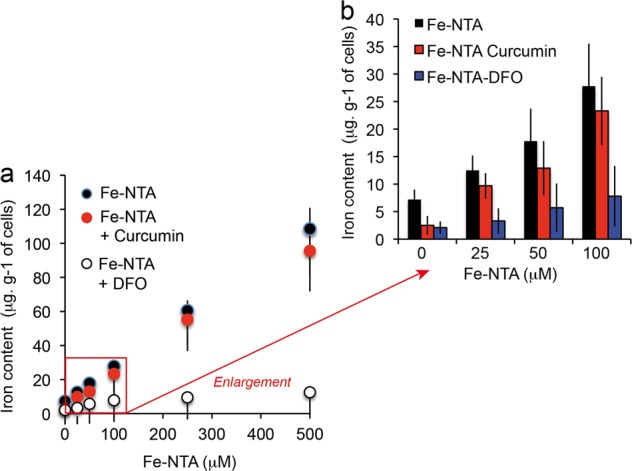
Fig. 3. Cellular iron content after loading with Fe-NTA.

a Fe-NTA cell loading (0–500 μM) and measurements of the intracellular iron content in presence of deferoxamine or curcumin (20 μM). b Enlargement of the Fe-NTA cell loading in the lower range between 0 and 100 μM in the presence or absence of deferoxamine (excess, 250 μM) or curcumin (20 μM). For a and b, the means ± S.E. are presented from at least 10 independent determinations.
