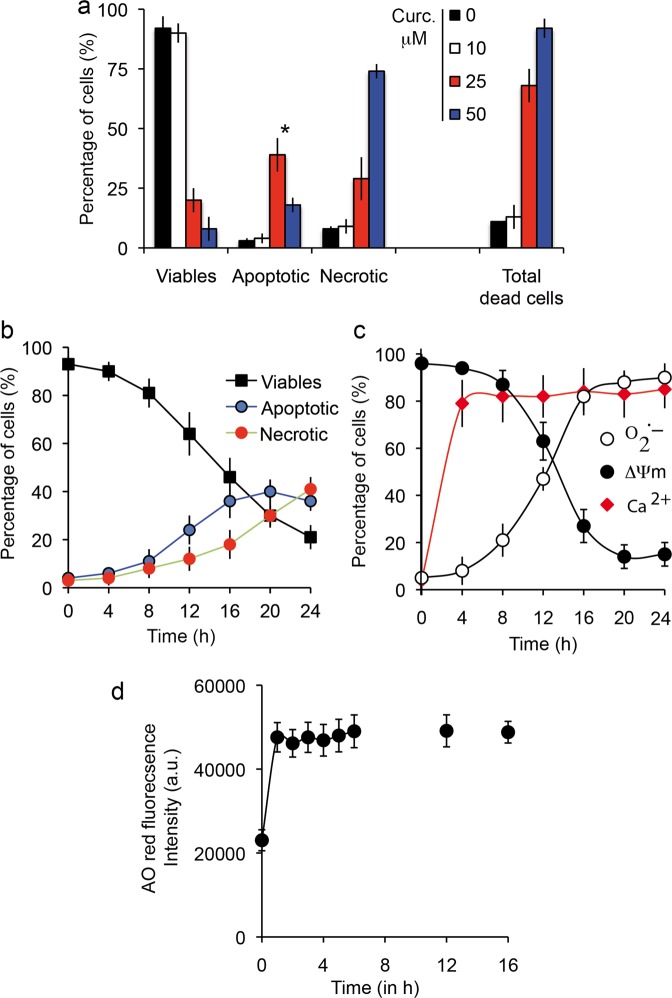
Fig. 5. Prototypic induction of cell death by curcumin.
a Flow cytometry analysis of Huh-7 cell death. Percentage of viable, apoptotic and necrotic cells among cells treated with various concentrations of curcumin (0–50 μM for 24-h incubation). YO-PRO-1/PI staining was used to analyze membrane permeability and discriminate three populations: YO-PRO-1−/PI− for viable cells, YO-PRO-1+/PI− or YO-PRO-1+/PI intermediate for apoptotic cells and YO-PRO-1+/PI+ for necrotic cells. Asterisk inidicates the maximal number of apoptotic cells was observed at 25 μM curcumin for 24 h. Data are expressed as the mean ± S.D. (n = 7). b Same as in panel a but plotted as a function of time from 0 to 24 h for 25 µM curcumin. Data are expressed as the mean ± S.D. (n = 7). c Metabolic measurements linked to dying cells after 24-h incubation with 25 µM curcumin. Mitochondrial membrane potential with DiOC6(3) fluorescence (ΔΨm, black circles), superoxide anion generation tested with MitoSOX-green fluorescence (O2.−, empty circles) and calcium increase measured with Fluo 4-AM (intracellular calcium, red diamonds). Data are expressed as the mean ± S.D. (n = 10).

