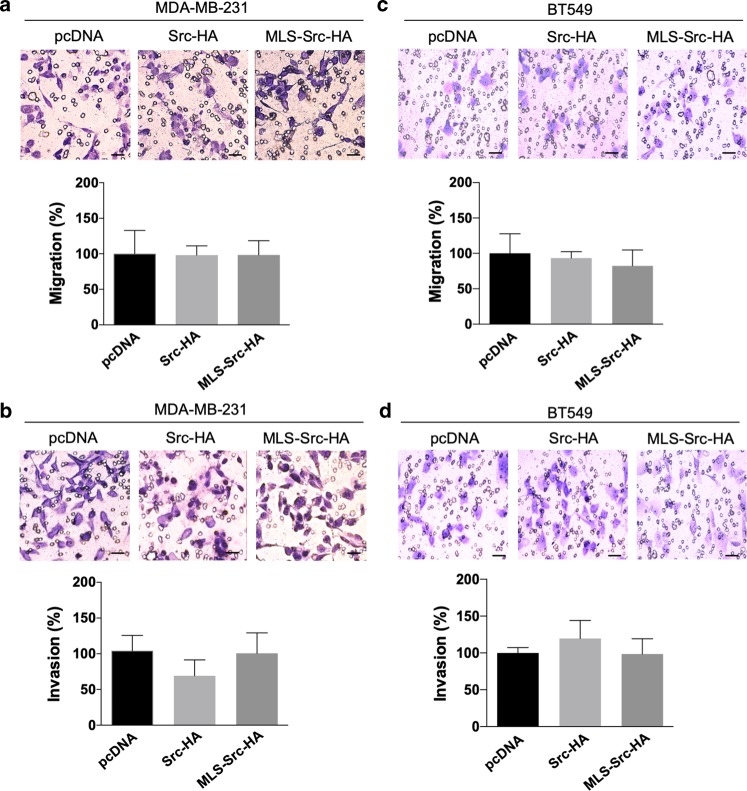
Fig. 5. Migration and invasion capacities upon expression of (mt)Src in MDA-MB-231 and BT549 cells.
a Representative micrographs and quantification of transwell assays without matrigel to evaluate migration of MDA-MB-231 cells expressing empty vector (pcDNA), Src-HA or MLS-Src-HA (n = 5). b Representative micrographs and quantification of transwell assays with matrigel to evaluate invasion capacities of MDA-MB-231 cells expressing empty vector (pcDNA), Src-HA or MLS-Src-HA (n = 5). c Representative micrographs and quantification of transwell assays without matrigel to evaluate migration of BT549 cells expressing pcDNA, Src-HA or MLS-Src-HA (n = 5). d Representative micrographs and quantification of transwell assays with matrigel to evaluate invasion capacities of BT549 cells expressing empty vector pcDNA, Src-HA or MLS-Src-HA (n = 5). Scale bar: 50 µm. Data are presented as mean ± s.e.m. Data were analyzed by one-way ANOVA.

