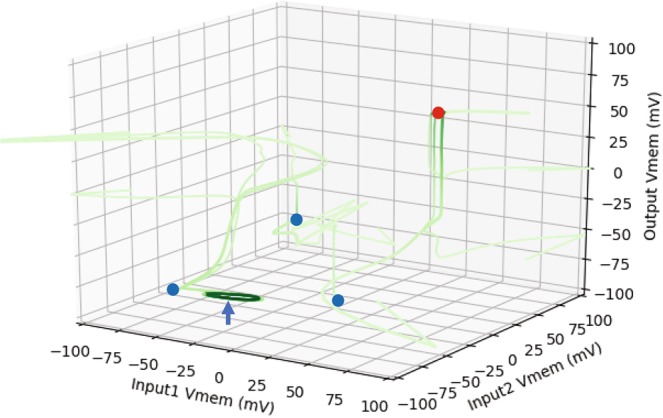
Figure 5.

The dynamical phase space of the best tissue-level AND gate. A depiction of a set of trajectories in the input-output space, illustrated in a time-lapse style. This dynamical system has two attractors in the output space, highlighted in filled blue (hyperpolarized state) and red (depolarized state) circles. As can be seen, there are three standard hyperpolarized attractors (fixed-point-like), and a fourth cyclic hyperpolarized attractor (marked with a blue arrow). Even though the cyclic attractor is in the appropriate region of the phase space, it was not actually required for during the training—it accidentally emerged. Furthermore, as opposed to the straight trajectories of the previous phase space diagrams, the trajectories maneuver freely here, and occasionally spill over the usual Vmem range which is about [−100,100] mV. This is because the inputs are transient and not fixed, hence they change states as well over time.
