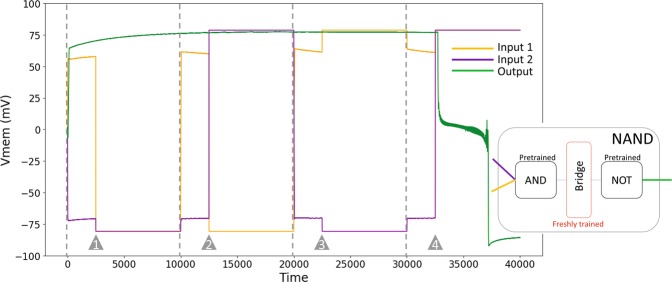
Figure 7.
The behavior of a successfully trained NAND gate for a random sequence of four inputs. Orange and purple lines represent the activities of the inputs, while green represents the output. The vertical dashed lines mark the beginning of each trial in the sequence, however the inputs are applied, after an initial transient, at the time points marked by the grey triangles. Inset is a schematic of the architecture of the gate: pretrained AND and NOT gates are connected by a “bridge”, a single layer of cells, that is alone trained.

