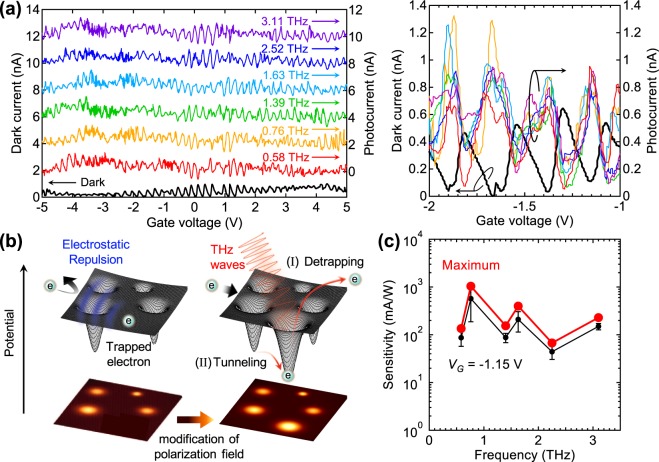
Figure 3.
THz response of the highly doped-Si QD with the antenna at six frequencies. (a) Dark current I0 (the dark curve) and THz photocurrent ITHz(f) (the other colored curves) at source–drain voltage of 5 mV. THz photocurrent depicted in left figure are offset by multiples of 2 nA. The right figure is smaller VG range. (b) Schematic view of the THz responses in the Coulomb blockade region; (I) detrapping process of the localized electron in donor levels; (II) THz-assisted tunneling process between the donor levels. These processes provide the modification of polarization field as shown in the bottom plains. (c) Frequency dependence of the maximum and VG-fixed sensitivity.

