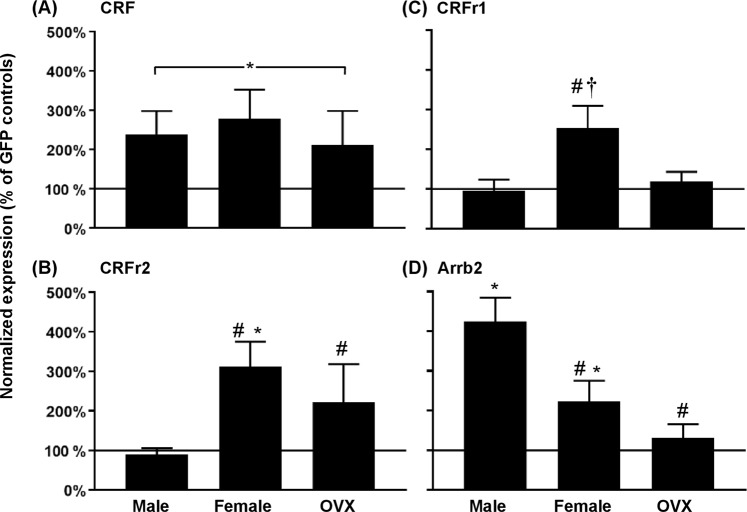
Fig. 6.
Gene expression (±SEM) of CRF (a), CRFr2 (b), CRFr1 (c), and Arrb2 (d) in the NAc of male, female, and OVX female rats. The data were normalized and then expressed as a percentage of their respective GFP control levels. The asterisk (*) denotes a significant difference between Nicotine-CRF and Nicotine-GFP groups, the number sign (#) denote a difference from males, and the dagger (†) denotes a difference from OVX females (p ≤ 0.05)

