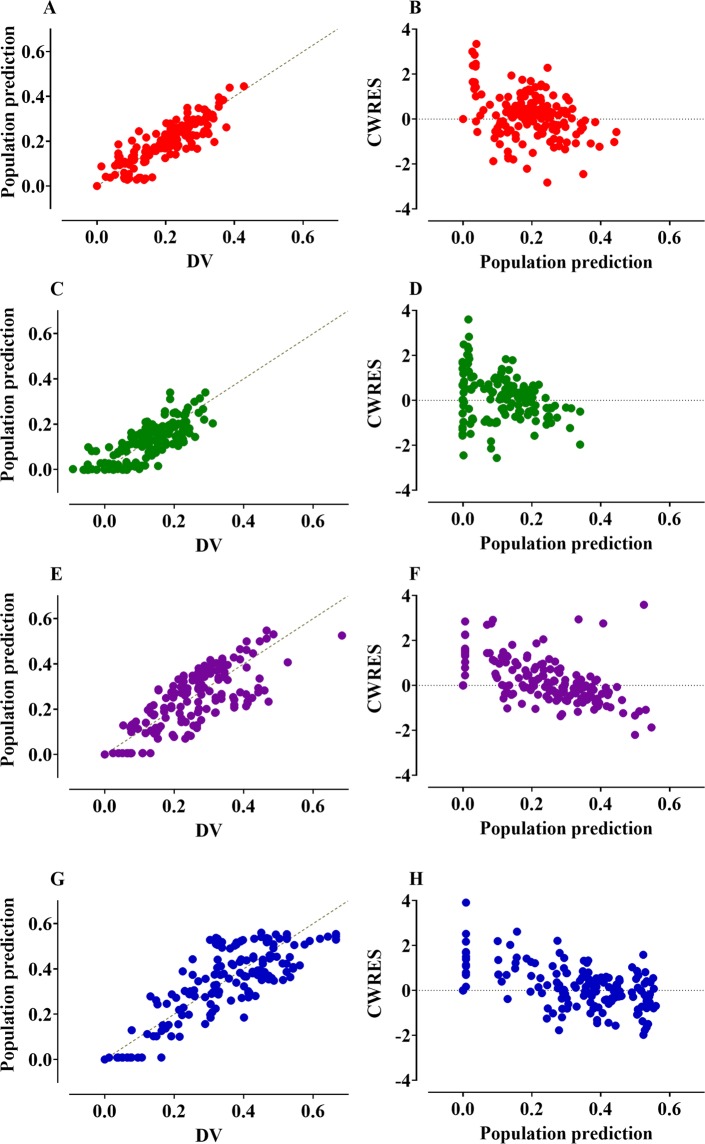
Figure 3.
Goodness-of-fit plots of the final volume kinetic models. Ringer’s lactate solution (A,B), 5% dextrose water (C,D), 6% tetrastarch (E,F), and 10% pentastarch (G,H). (A,C,E,G) Population prediction vs. plasma dilution, (B,D,F,H) conditional weighted residuals (CWRES) vs. population prediction. The gold dashed lines indicate the lines of identity.

