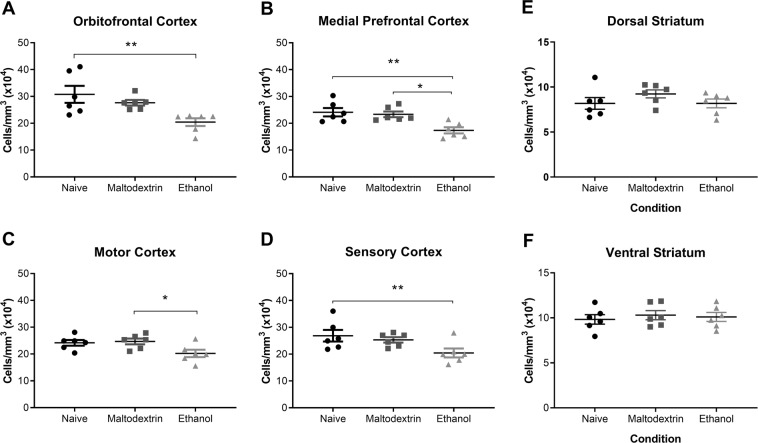
Figure 8.
Cell Density in the Prefrontal Cortex and Ventral Striatum. (A) Cell density was significantly decreased in the OFC of Alcohol group rats compared to Naïve but not Maltodextrin. (B) Cell density was decreased in the mPFC of the Alcohol group compared to Naïve and Maltodextrin. (C) Cell density was decreased in the motor cortex of Alcohol group compared to Maltodextrin, but not Naive rats. (D) Cell density significantly decreased in the sensory cortex of Alcohol group rats compared to Naïve but not Maltodextrin. In the striatum, there were no difference between groups within either the dorsal (E) or ventral (F) regions. *p < 0.05, **p < 0.01, all error bars indicate SEM. n=6 per group.

