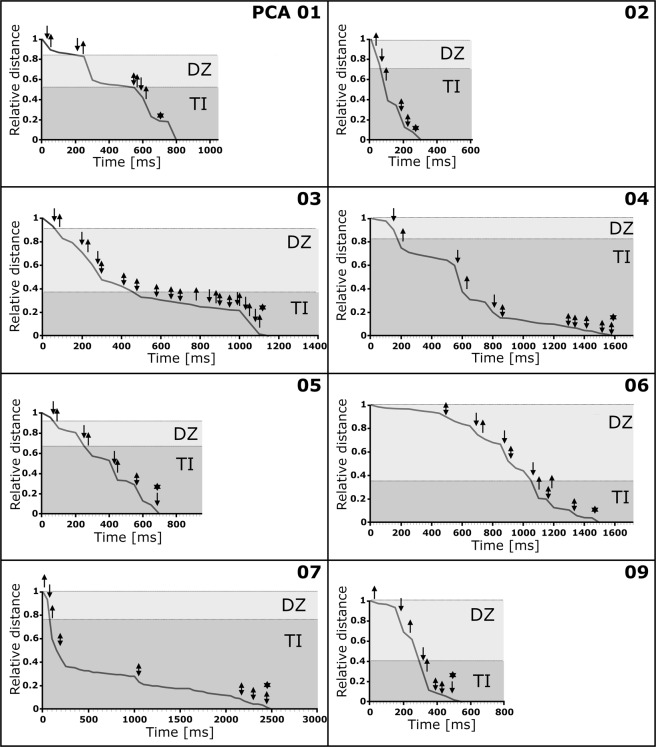
Figure 4.
Graphical representation of Daphnia longicephala movements and behaviour during the successful PCAs 1–7 & 9. The relative distances of the prey animals to their respective final positions (see Materials and Methods for details) are indicated. The danger zones (DZ) are depicted in light grey, the trap interior zones (TI) in dark grey. The following events are indicated by symbols: an upwards pointing arrow corresponds to a second antennae return stroke, an arrow pointing downwards corresponds to a second antenna downstroke, a double arrow corresponds to an asynchronous second antennae movement, and an asterisk corresponds to trap triggering.

