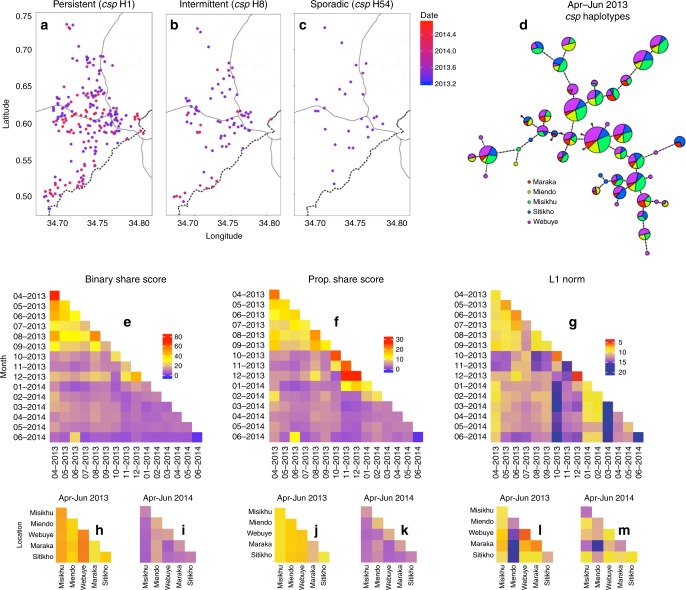
Fig. 3. Genetic similarity of csp haplotypes is structured by time more than space.
a–c Location of study participants with ‘persistent’ haplotype csp H1 (a), ‘intermittent’ haplotype csp H8 (b), and ‘sporadic’ haplotype csp H54 (c). Blue color indicates the beginning (April 2013) and red the end (June 2014) of the study period, with the date denoting fractional years in decimal notation. d csp haplotype network for the high transmission season of April through June 2013 (for five most represented administrative locations: Maraka, Miendo, Misikhu, Sitikho, and Webuye). Each circle indicates a unique haplotype with size proportional to the log2-scaled haplotype prevalence and color denoting the fractional prevalence in each administrative location. Haplotype connections were calculated using an infinite site model (Hamming distance) of DNA sequences, with dots along connections indicating the number of base-pair differences between sequences. e–g Temporal comparison heat maps of mean binary haplotype sharing (e), proportional haplotype sharing (f), and L1 norm genetic distance (g) calculated between months of study enrollment. h–m Spatial comparison heat maps of binary haplotype sharing (h, i), proportional haplotype sharing (j, k), and L1 norm genetic distance (l, m) calculated for a distinct temporal window (h, j, l: April-June 2013; i, k, m: April–June 2014) for the five most represented administrative locations (see above), which are arranged from north to south (see map in Fig. S1). For (e–m), blue denotes the minimum for each genetic similarity index, red the maximum, and yellow the midpoint.

