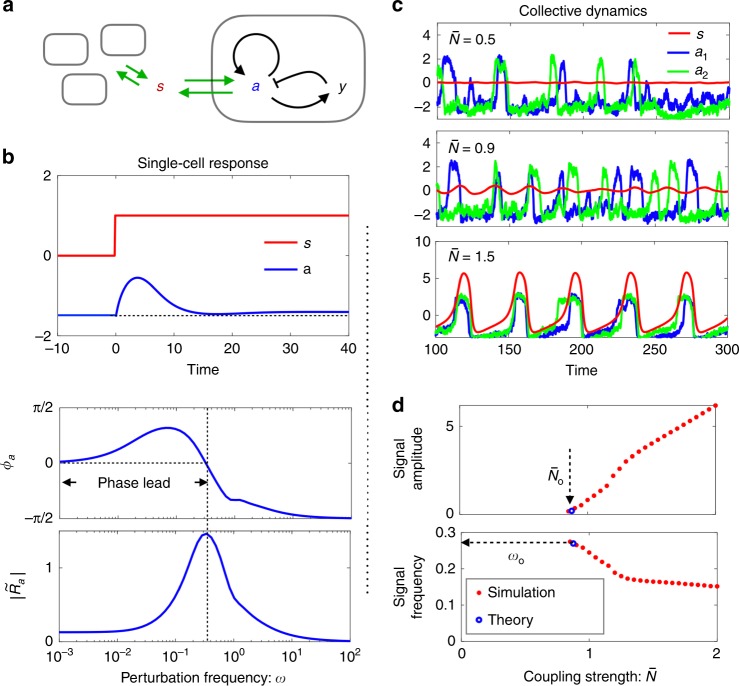
Fig. 4. Simulations of the coupled excitable FitzHugn-Nagumo (FNH) model with noise.
a Model illustration. Note the self-activation of that gives rise to excitability (see Methods for details). b Noise-averaged response of in the resting state. Upper panel: the average response to a step signal. Lower panel: the response amplitude and phase shift at various signal frequencies. c Trajectories of the coupled FHN model at various values of the effective coupling strength . In addition to the signal , activities of two out of a total of 1000 cells are plotted. d Signal oscillation amplitude and frequency against effective cell density. Red stars: simulation data; Blue circles: predictions of Eqs. (4)–(5) using numerically computed response spectra.

