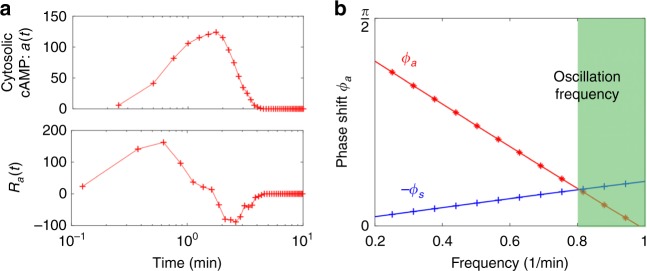
Fig. 6. Intracellular activity response function constructed from single-cell measurements on Dictyostelium.
a Upper panel: The average cytosolic cAMP level (the activity , arbitrary unit) in response to a step increase of 1 nM extracellular cAMP at (reproduced from Fig. 2a in ref. 3). Lower panel: The response function estimated from the derivative of the response data in the upper panel. b The corresponding phase shift in the low frequency regime (red curve), obtained from the Fourier transform of . Onset oscillation frequencies in experiments reside in the green region (see Fig. 2b in ref. 2). Also shown is the phase shift from Eq. (6) at min (blue curve), the extracellular signal clearance time to yield an onset oscillation period of about 8 min. Faster signal clearance shortens the oscillation period towards the theoretical lower bound at around 6.28 min.

