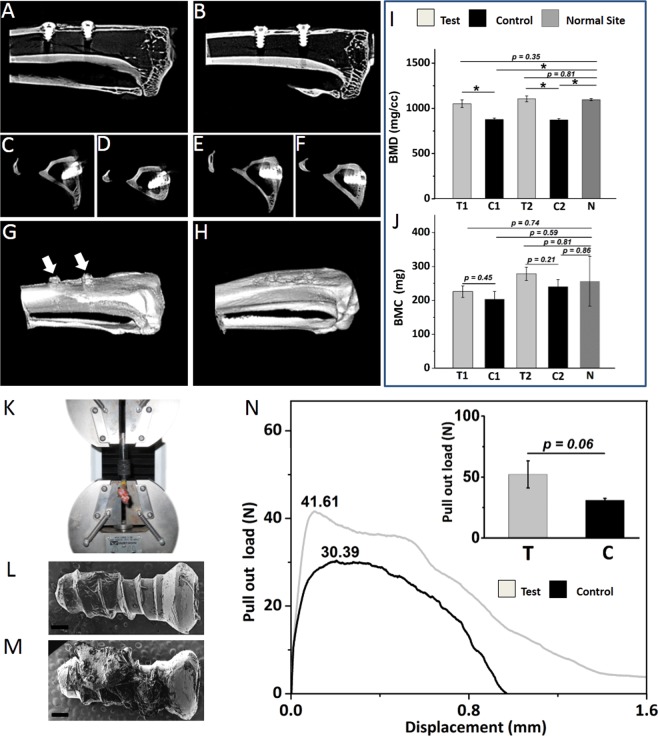
Figure 5.
Analysis of trabecular bone determined by micro-CT and pullout evaluation procedure in test and control implants placed in rabbit’s tibiae at the end of 12th week. (A) cross section of right tibia with control implants in sagittal plane (B) left tibia with test implants in sagittal plane (C) cross section of control implant no. 1 in axial plane (D) control implant no. 2 in axial plane (E) test implant no. 1 in axial plane (F) test implant no. 2 in axial plane. 3D images of (G) right and (H) left tibia of rabbit at the end of 12th week post implantation. The titanium implant screws has been omitted from the 3D images. The presence of hyperplastic fibrous tissues emanating upwards and outwards from the bone-implant interface could be noted surrounding the control implants (arrows).The cortical bone surrounding the test implants demonstrates significantly greater values over time in BMD (I), BMC (J) relative to controls and are comparable to “normal” unoperated sites. (K) Procedure of mechanical pull-out tests of osseointegrated implants. Representative SEM image of the retrieved (L) control implant and (M) test implant. Scale bar represents 200 μm (N) Representative Force–displacement curves for the test and control implant after 12 weeks study period. The figure inset displays the mean result of ultimate tensile strength for test and control implants. The test implant exhibited increase residual calcified tissues on its surface and higher ultimate tensile strength compared to control. Abbreviations:- BMD - Bone mineral density, - BMC - Bone mineral content, -T- Test implants, -C- Control implants, - T1 - Test implant no. 1, - T2 -Test implant no. 2, - C1 - Control implant no. 1, - C2 - Control implant no. 2,- N - Normal (unoperated) site of tibia. Data are expressed as mean ± standard error of mean (SEM). Student’s t-test was performed with data significance indicated with (*) for p < 0.05.

