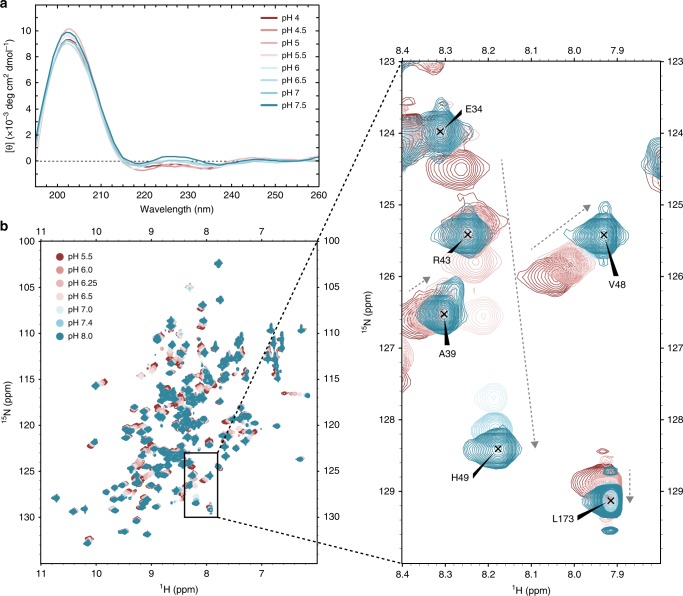
Fig. 2. Effects of pH on hMYDGF.
a Smoothed CD spectra of hMYDGF in buffer ranging from pH 4.0 (maroon) to pH 7.5 (blue). Spectra were baseline subtracted from their corresponding buffer spectra. Source data for each spectra are provided as a Source Data file. b 1H, 15N HSQC spectra of hMYDGF in buffers ranging from pH 5.5 (maroon) to pH 8.0 (blue). Full spectra (left) and a representative expanded view (right) display a range of peak shifts from no movement (e.g., E34), to highly pH-sensitive peaks (e.g., H49). Arrows represent direction of peak perturbation as a result of increasing pH. Assignments shown are for peaks at pH 8.0.

