Figure 2.
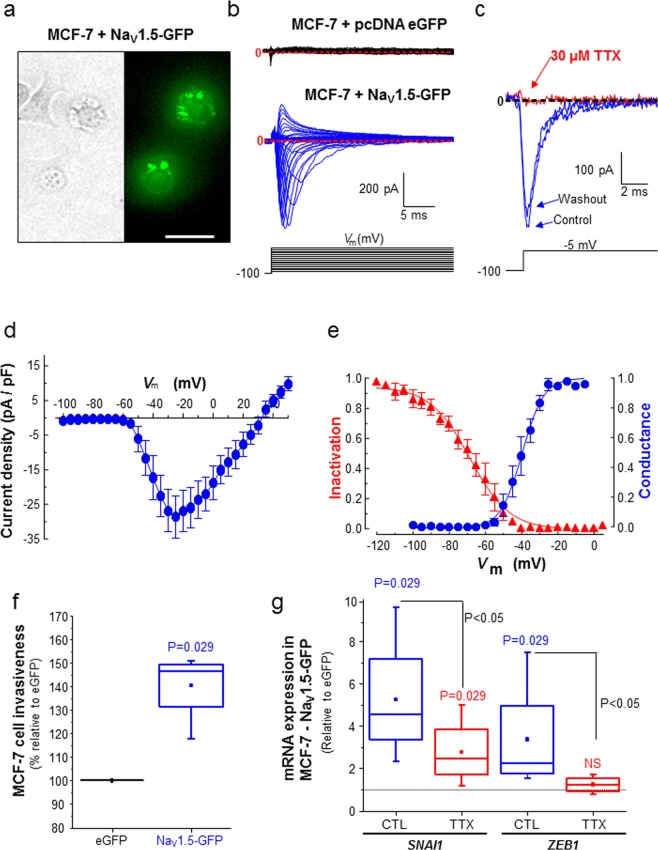
SCN5A/NaV1.5 heterologous expression in poorly aggressive MCF-7 cells increases invasive phenotype. (A) Representative micrographs showing MCF-7 cells transfected with NaV1.5-GFP in phase contrast (left) and in epifluorescence (right), 24 h after transfection. Scale bar, 20 µm. (B) Representative whole-cell current recordings obtained in MCF-7 cells transfected with either eGFP pcDNA3.1 (top recordings, black traces), or from MCF-7 cells transfected with NaV1.5-GFP pcDNA3.1 (bottom, blue traces), in response to depolarizing 30-ms pulses from −95 to +60 mV in 5-mV steps applied every 2 s from a holding potential of ─100 mV. Red dotted lines indicate baseline levels (zero current). (C) Representative whole-cell voltage-gated sodium currents recorded at −5 mV from a holding potential of −100 mV in absence (Control, PSS solution), presence of TTX (30 µM) and after washing out the toxin with PSS (Washout). (D) Current density-voltage (I-V) relationship for NaV1.5-GFP channels heterologously expressed in MCF-7 cells (n = 7). Peak sodium currents were averaged and plotted as a function of the depolarizing potential (Vm). (E) Conductance-voltage (blue circles) and steady-state inactivation-voltage (red triangles) relationships of peak Na+ currents recorded in MCF-7 cells heterologously expressing NaV1.5-GFP channels. Smooth lines are fits to Boltzmann functions and V1/2 values were calculated for each parameter. V1/2-activation: −39.5 ± 0.6 mV and V1/2-inactivation: −68.6 ± 1.2 mV. Data were obtained from five cells, and are presented as mean ± sem. (F) Invasiveness of MCF-7 cell transfected with NaV1.5-GFP expressed as a ratio to expression levels in cells transfected with eGFP. Data were obtained from 4 independent experiments, with 3 inserts per condition (P = 0.029, Mann-Whitney rank sum test). (G) mRNA expression levels of SNAI1 and ZEB1 genes assessed by RT-qPCR in MCF-7 cells transfected with NaV1.5-GFP and treated with tetrodotoxin (TTX, 30 µM) or not (CTL, vehicle) and expressed as ratios to expression levels in MCF-7 transfected with eGFP (n = 4 separate experiments, Mann-Whitney rank sum test). NS stands for “no statistical difference”.

