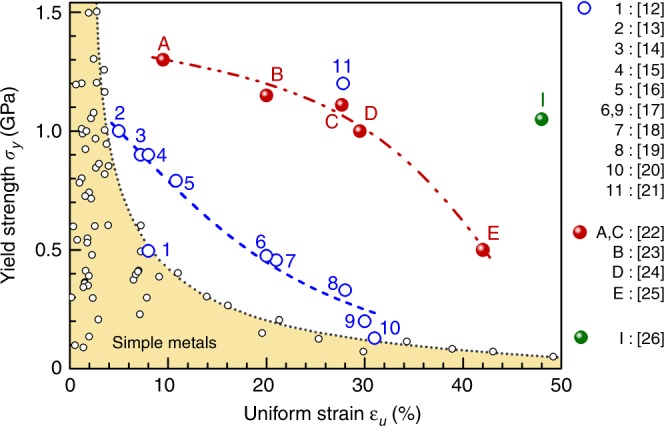
Fig. 1.

Yield strength versus uniform tensile strain. The yellow-shaded area under the banana-shaped dotted curve covers the strength–ductility data of typical conventional metals. The reader is referred to the literature11 for the data points already summarized previously. The open blue circles along the blue dashed line (a guide to the eye) are HNM examples, from refs. 12–21, examples of recent heterogenous HEAs are shown along the red dashed line, see solid red circles A–E from refs. 22–25 Case I, the solid green circle, is for a very recent complex alloy containing multicomponent intermetallic nanoparticles26.
