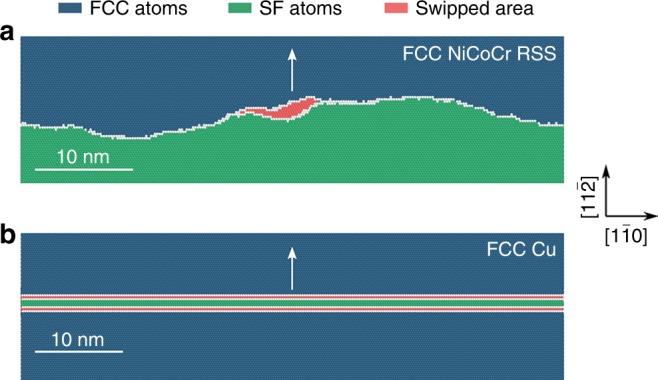
Fig. 8.

Dislocation motion in FCC lattice. The molecular dynamics simulation was performed using embedded atom method (EAM) potentials, see ref. 89 for details. To observe configurations associated with the intrinsic potential valley, all configurations were cooled to zero temperature and unloaded to zero stress from stressed MD simulations at 300 K, and further relaxed by energy minimization. a Wavy dislocation line in FCC-NiCoCr MEA random solid solution (RSS). The leading partial (LP) dislocation moves forward in the direction marked with an arrow, one local segment at a time, while the trailing partial (TP) lags far behind (out of the picture) because the energy cost associated with erasing the stacking fault (green) is relatively high89. The locations of the dislocation line at two times, t1 and t2, clearly reveals the nanoscale segment detrapping mechanism: the swept area (scaling with activation volume) in one stick-slip event is shown in red. This is in sharp contrast with the familiar behavior of dislocation in normal FCC, shown in b using Cu as example, where a long dislocation line (both the straight LP and TP shown in the figure) marches easily as a whole from one Peierls valley to the next.
